Fig. 7.
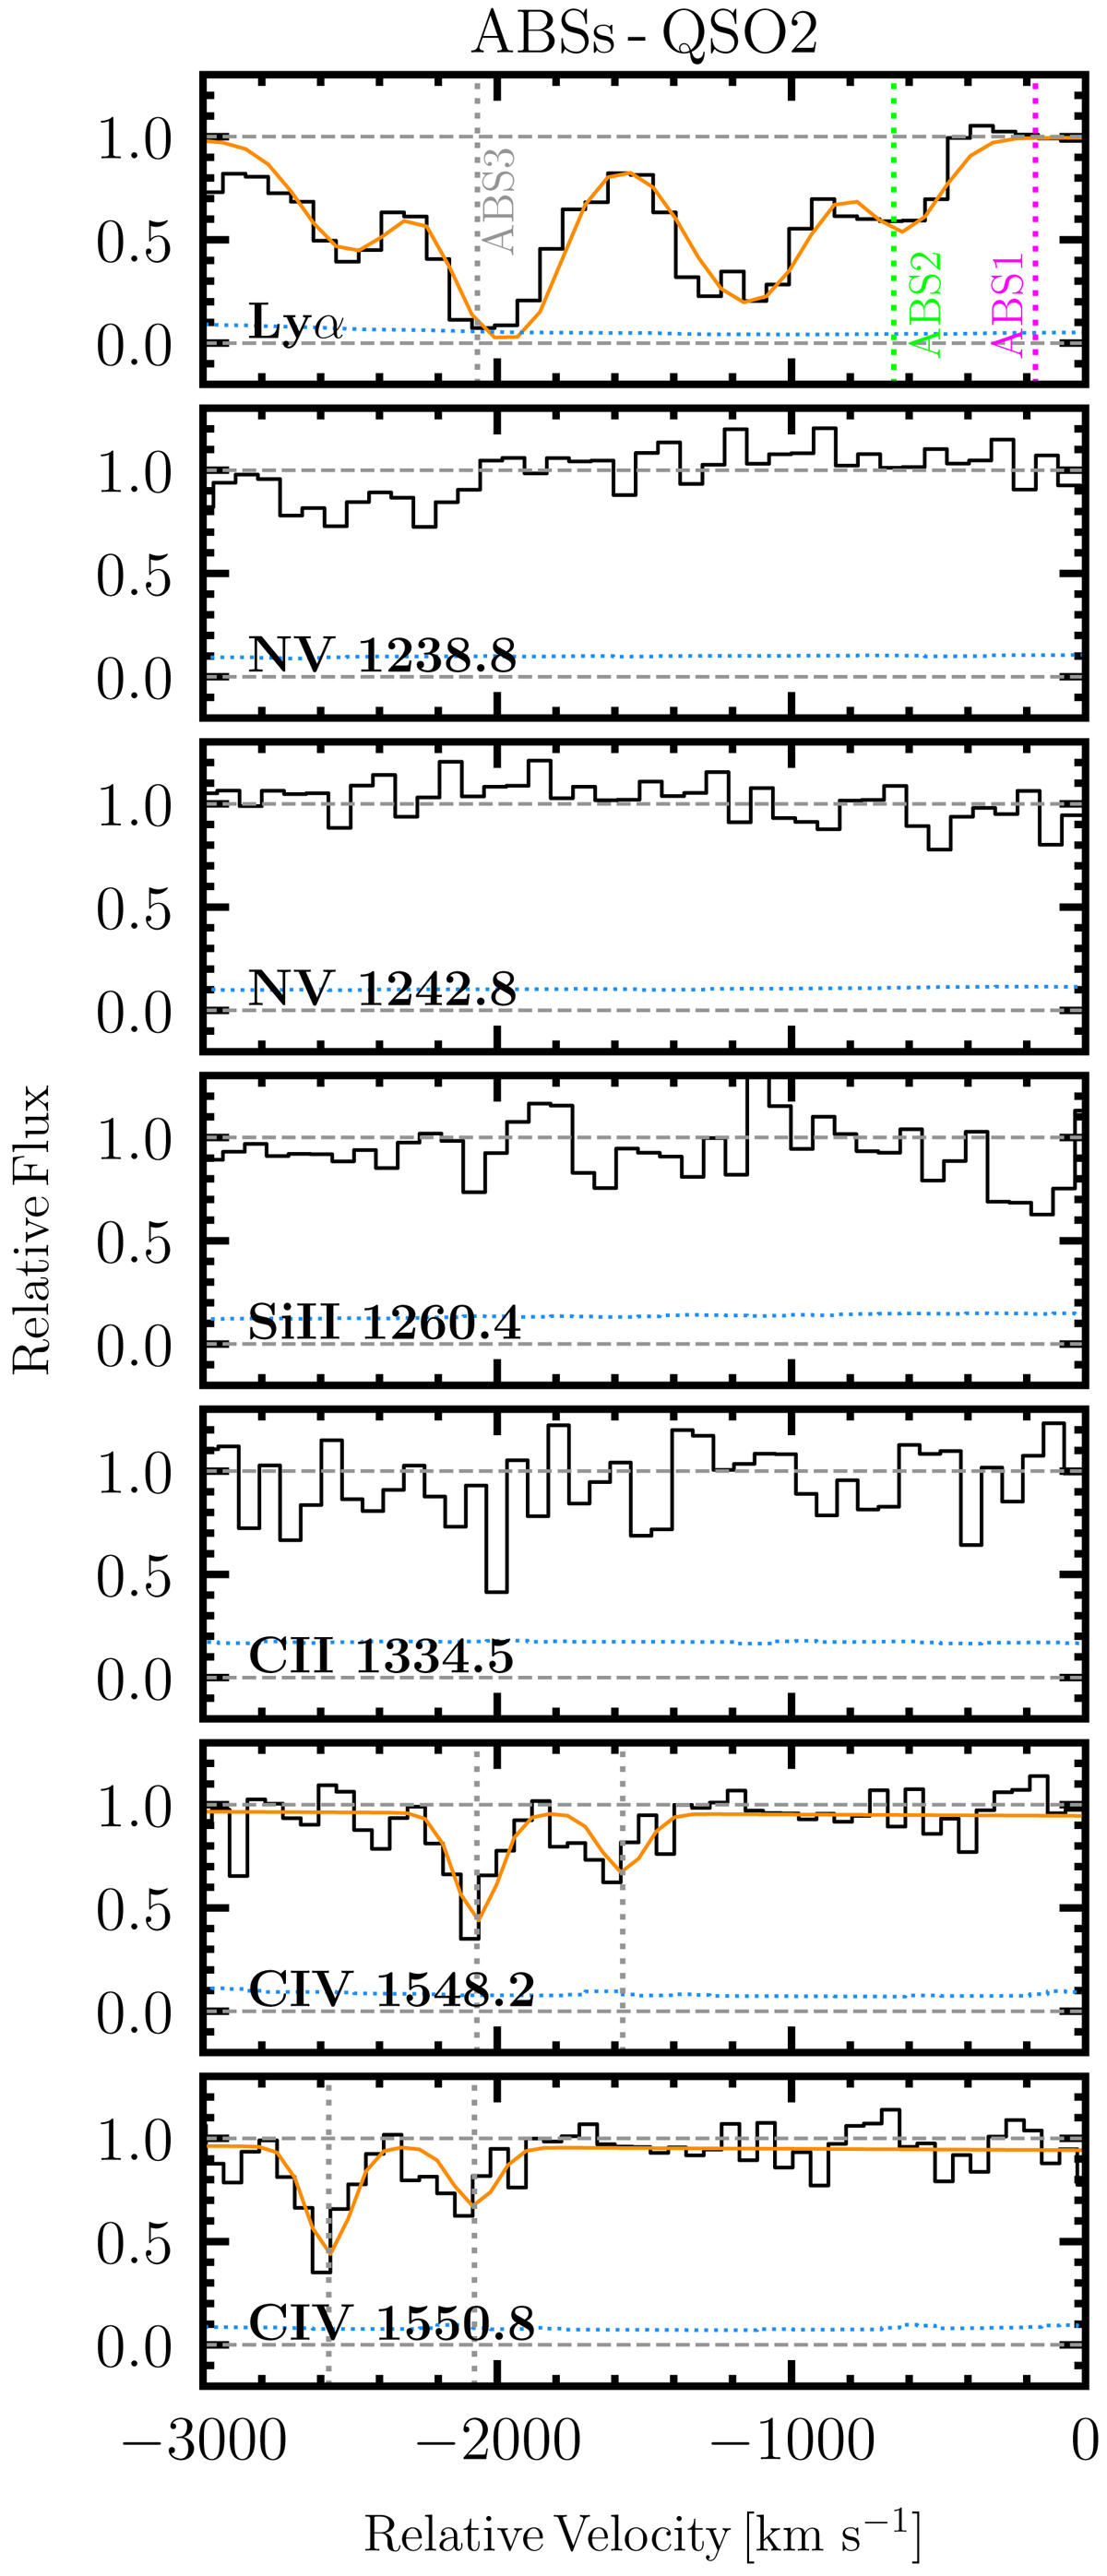
Profiles of the absorbers along the QSO2 sight-line at the H I Lyα line, N V, Si II, C II, and C IV lines. The black histograms show the continuum normalized data, while the orange lines are the sum of all the Gaussian components of the best fit. The location of the absorbers considered are highlighted with vertical dashed lines, that is, ABS1 (magenta; not present along this sight-line), ABS2 (lime), and ABS3 (gray). The zero velocity is set to the redshift of the C IV strongest component of ABS1 along the QSO1 sight-line, as in Fig. 6. Table 2 gives all the relevant fit parameters.
Current usage metrics show cumulative count of Article Views (full-text article views including HTML views, PDF and ePub downloads, according to the available data) and Abstracts Views on Vision4Press platform.
Data correspond to usage on the plateform after 2015. The current usage metrics is available 48-96 hours after online publication and is updated daily on week days.
Initial download of the metrics may take a while.