Fig. F.1.
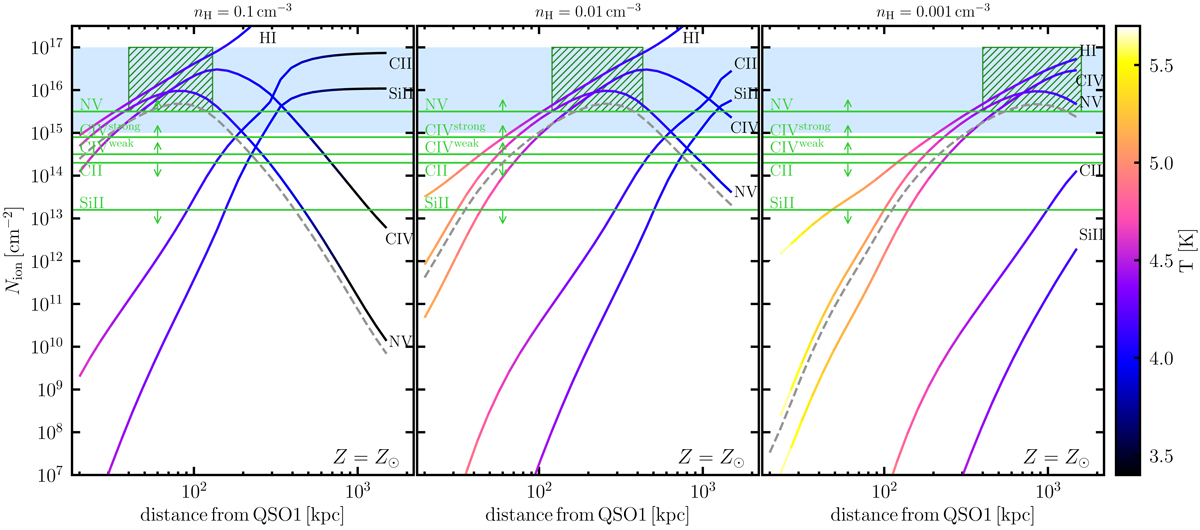
Predictions of photoionization models for the absorber ABS1 with Z = Z⊙, in the case it is illuminated by QSO1 and the UVB (see Appendix F for details on the models assumptions). The predicted column densities for H I, C IV, N V, C II, and Si II are plotted as a function of distance from QSO1. The horizontal green lines with arrows indicate the observational limits for the same metal ions, while the blue shaded regions show the observational limits for H I. The green hatched boxes indicate the regions where the models matched the observations. The model curves are color-coded following the predicted temperature. The gray dashed lines represent the curves for N V for Z = 0.5 Z⊙. The models in agreement with the observations are characterized by 4.1 ≲ log(T/K) ≲ 4.4 and −1.7 ≲ log U ≲ −0.7. To match the N V absorption, the metallicity should be Z > 0.3 Z⊙.
Current usage metrics show cumulative count of Article Views (full-text article views including HTML views, PDF and ePub downloads, according to the available data) and Abstracts Views on Vision4Press platform.
Data correspond to usage on the plateform after 2015. The current usage metrics is available 48-96 hours after online publication and is updated daily on week days.
Initial download of the metrics may take a while.