Fig. A.2.
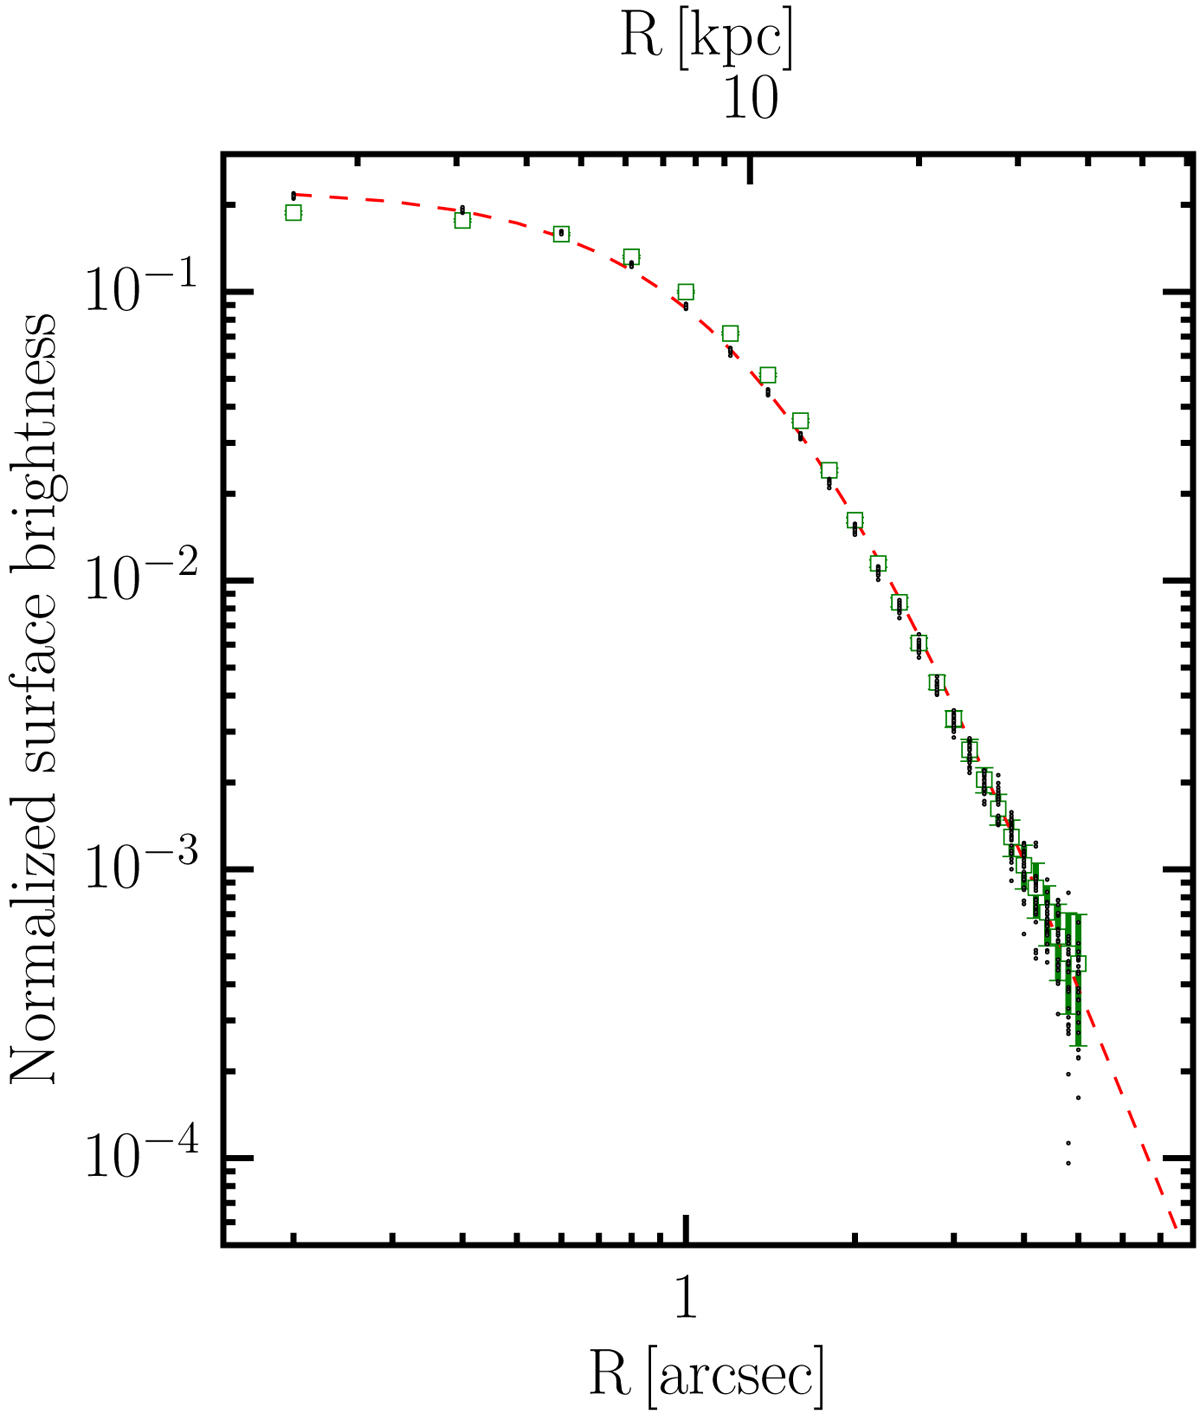
Normalized profile of the bright star used as PSF in this work. The open green squares show the normalized profile derived from the white-light image shown in the right panel of Fig. A.1, while the small dots show the normalized profiles for the star within the 17 MUSE layers encompassed by the obtained 3D mask for the extended Lyα emission (Sect. 3.2). The red dashed line is the best-fit Moffat profile to the white-light image data (β = 2.5 and FWHM = 1.66″). Given the brightness of the used star, there is very good agreement between the profile obtained from the white-light image and the individual layers.
Current usage metrics show cumulative count of Article Views (full-text article views including HTML views, PDF and ePub downloads, according to the available data) and Abstracts Views on Vision4Press platform.
Data correspond to usage on the plateform after 2015. The current usage metrics is available 48-96 hours after online publication and is updated daily on week days.
Initial download of the metrics may take a while.