Fig. 10.
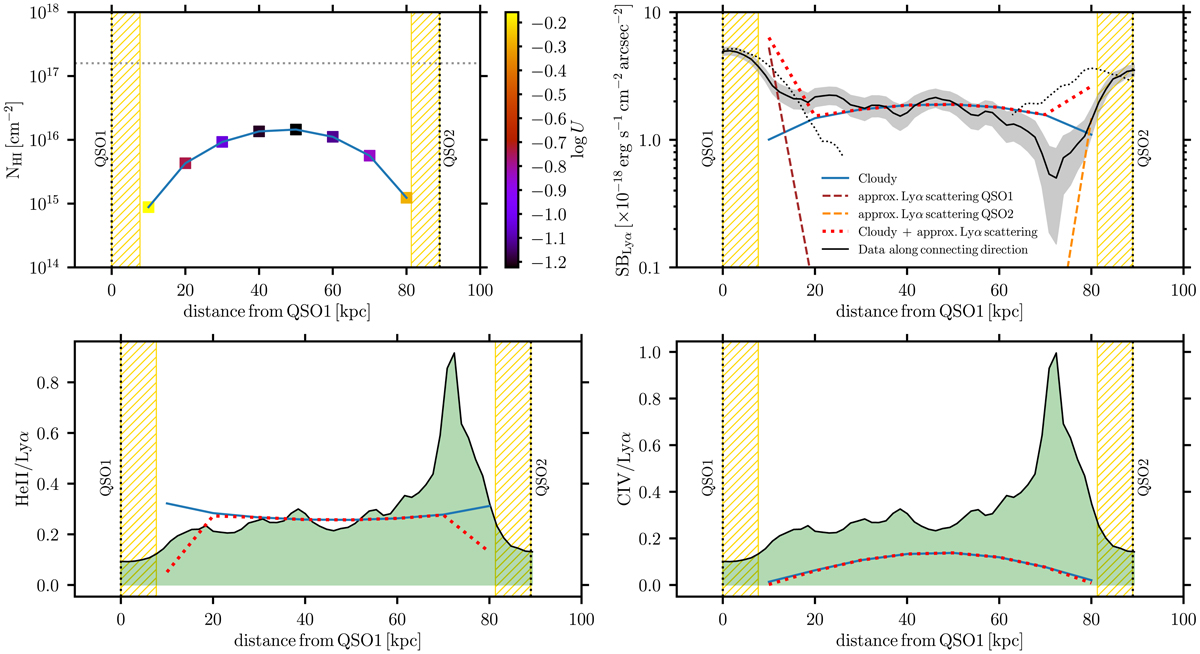
Cloudy predictions for plane parallel slabs with total log(NH/cm−2) = 20.5 and nH = 0.5 cm−3, illuminated by the quasar pair QSO1 and QSO2 placed at a separation equal to their observed projected distance (89 kpc). Top left: column density of H I, NH I, as a function of distance. For each model the data-points are color-coded by their respective ionization parameter. In this scenario all the models are optically thin to the ionizing radiation, that is, NH I < 1017.2 cm−2. Top right: comparison of the observed (black line with shaded 1σ error) and predicted SBLyα (blue line). The brown and dashed lines indicate the contribution due to scattering of Lyα photons from the quasars, as explained in Sect. 5.2.2. The red dotted line indicates the total SBLyα summing up the Cloudy prediction and the scattering contribution. The thin black dotted lines are the observed SBLyα along the directions NE for QSO1 and SE for QSO2, at angles 52 and 142° east from north, respectively (details in Sect. 5.2.4). Bottom left: comparison of the observed (black line is the 2σ upper limit) and the predicted (blue line) He II/Lyα ratio as function of the distance from the quasars. The green shaded area represents the parameter space allowed by the observations. Bottom right: comparison of the observed (black line is the 2σ upper limit) and the predicted (blue line) C IV/Lyα ratio as function of the distance from the quasars. The green shaded area represents the parameter space allowed by the observations. The vertical dotted lines in each panel indicate the position of the two quasars, while the striped yellow regions represent the zones used to normalize the quasar PSF, characterized by large uncertainties and, therefore, not considered in the analysis. The dotted red line represents the ratio corrected for the presence of Lyα scattering.
Current usage metrics show cumulative count of Article Views (full-text article views including HTML views, PDF and ePub downloads, according to the available data) and Abstracts Views on Vision4Press platform.
Data correspond to usage on the plateform after 2015. The current usage metrics is available 48-96 hours after online publication and is updated daily on week days.
Initial download of the metrics may take a while.