Fig. 8.
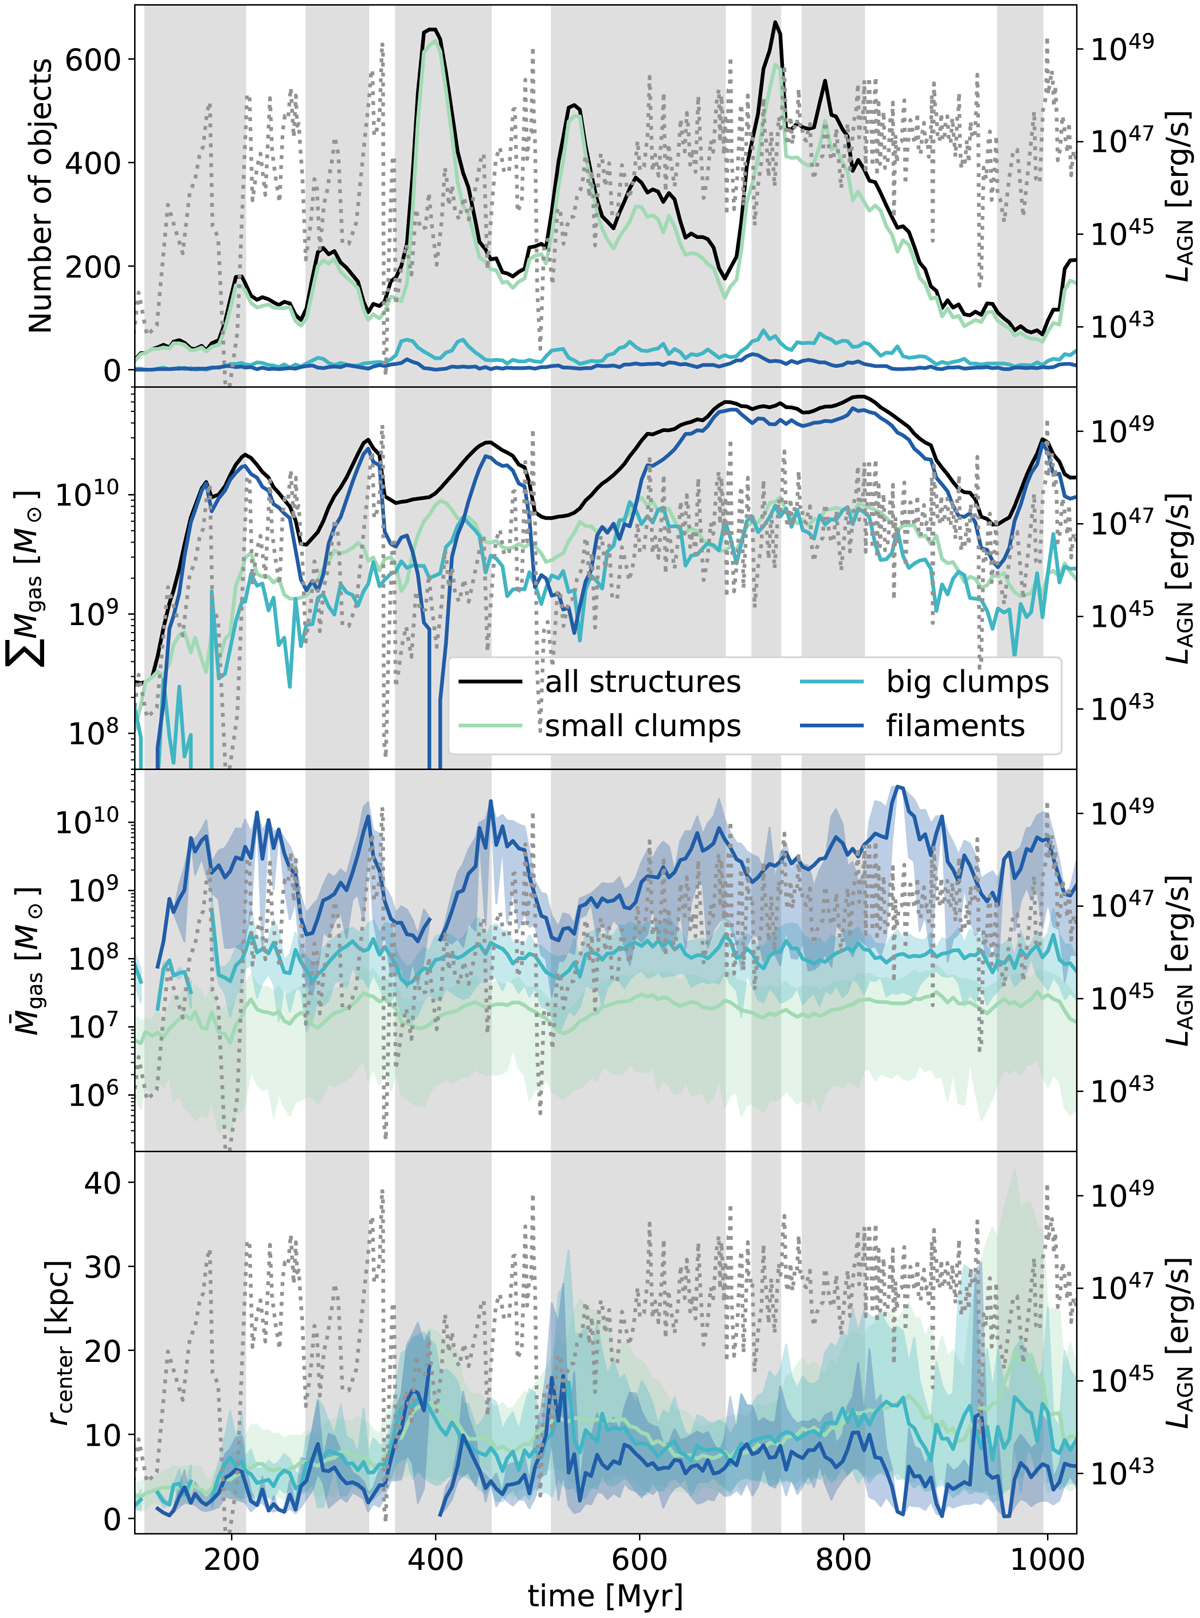
Time evolution of (from top to bottom) the number, total dense gas mass, mean gas mass and mean distance to the cluster centre for the three structure categories. Bottom two panels: solid lines show the mean and shaded regions the range from the 10th to the 90th percentile of the distribution. The dashed grey line in all plots shows the AGN luminosity for comparison.
Current usage metrics show cumulative count of Article Views (full-text article views including HTML views, PDF and ePub downloads, according to the available data) and Abstracts Views on Vision4Press platform.
Data correspond to usage on the plateform after 2015. The current usage metrics is available 48-96 hours after online publication and is updated daily on week days.
Initial download of the metrics may take a while.