Open Access
Fig. 5.
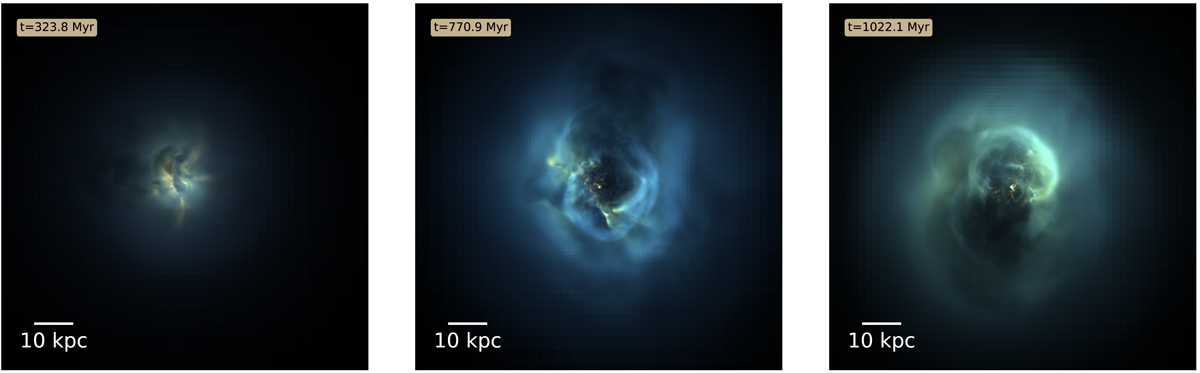
Synthetic composite X-ray images of the cluster centre, with 0.3−1.2 keV in red, 1.2−2 keV in green and 2−7 keV in blue, to match the image of Perseus in Fabian et al. (2006), towards the beginning, middle and end of the simulation. Each channel is scaled to highlight fainter features. Each image is 100 kpc across.
Current usage metrics show cumulative count of Article Views (full-text article views including HTML views, PDF and ePub downloads, according to the available data) and Abstracts Views on Vision4Press platform.
Data correspond to usage on the plateform after 2015. The current usage metrics is available 48-96 hours after online publication and is updated daily on week days.
Initial download of the metrics may take a while.