Open Access
Fig. 15.
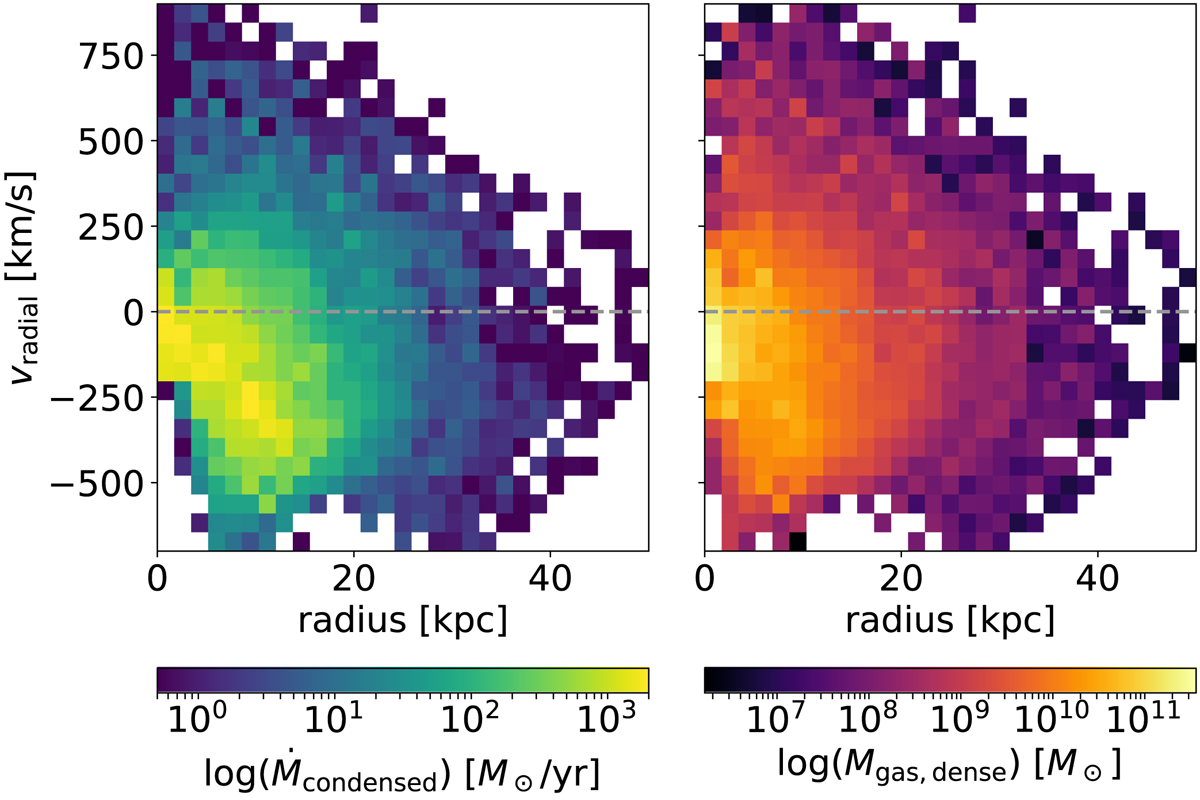
Phase plot of the total condensation rate (left) and total dense gas mass (right) over a range of radial positions and radial velocities of the clumps. Data shown here is stacked over all clumps at all snapshots of the simulation.
Current usage metrics show cumulative count of Article Views (full-text article views including HTML views, PDF and ePub downloads, according to the available data) and Abstracts Views on Vision4Press platform.
Data correspond to usage on the plateform after 2015. The current usage metrics is available 48-96 hours after online publication and is updated daily on week days.
Initial download of the metrics may take a while.