Fig. 5.
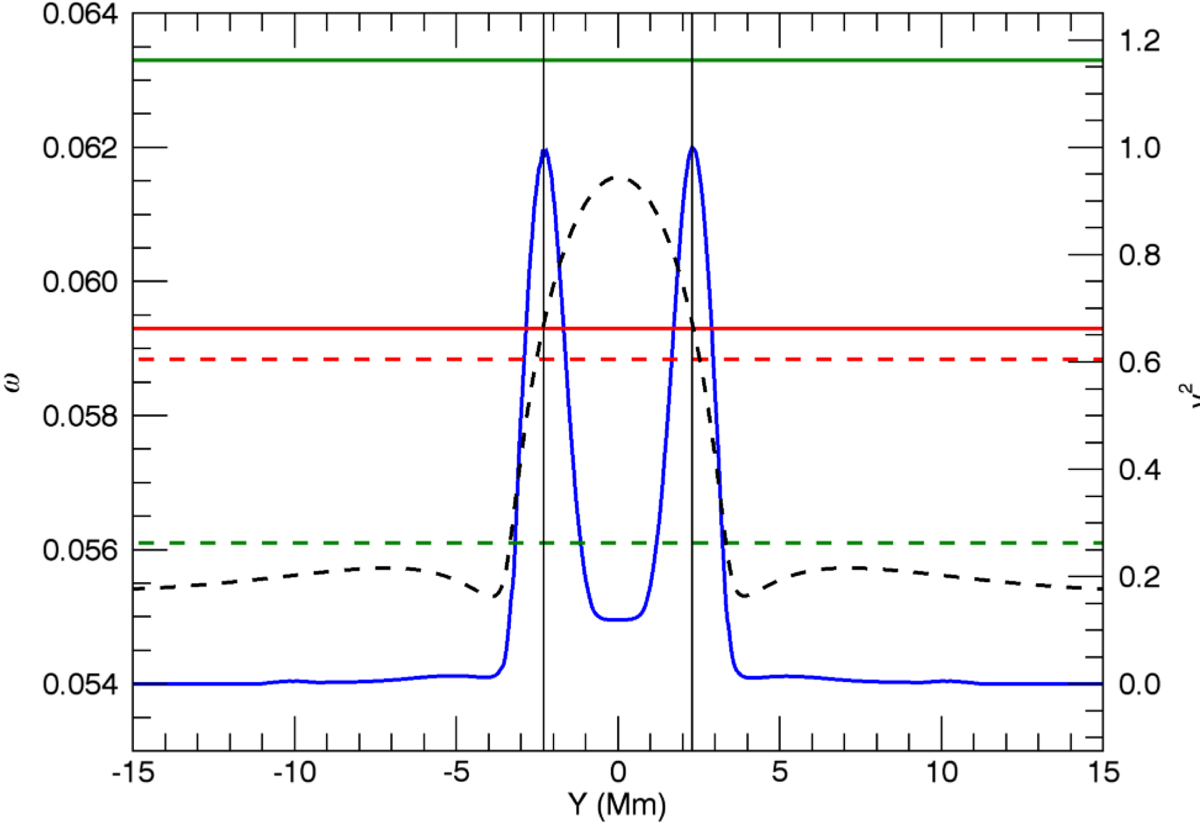
Dashed black line: natural Alfvén frequencies of field lines at the loop apex. Solid red line: kink frequency generated in the simulation. Green lines: Theoretical estimates of the frequency of the fundamental kink mode using the kink speed, vk, at the loop apex (dashed line) and tracking vk as a function of position along the loop axis (solid line). The estimate calculated using the kink speed at the loop foot points is significantly larger and is thus omitted from the figure. Dashed red line: additional estimate of the kink frequency calculated by solving an eigenvalue problem. Blue line: square of the azimuthal velocity, vϕ, integrated in time over a wave period once significant energy has been transferred through resonant absorption (t ≈ 1500 s). This is normalised to the maximum value observed. Solid black line: location of peak power for the azimuthal Alfvén wave.
Current usage metrics show cumulative count of Article Views (full-text article views including HTML views, PDF and ePub downloads, according to the available data) and Abstracts Views on Vision4Press platform.
Data correspond to usage on the plateform after 2015. The current usage metrics is available 48-96 hours after online publication and is updated daily on week days.
Initial download of the metrics may take a while.