Fig. 10.
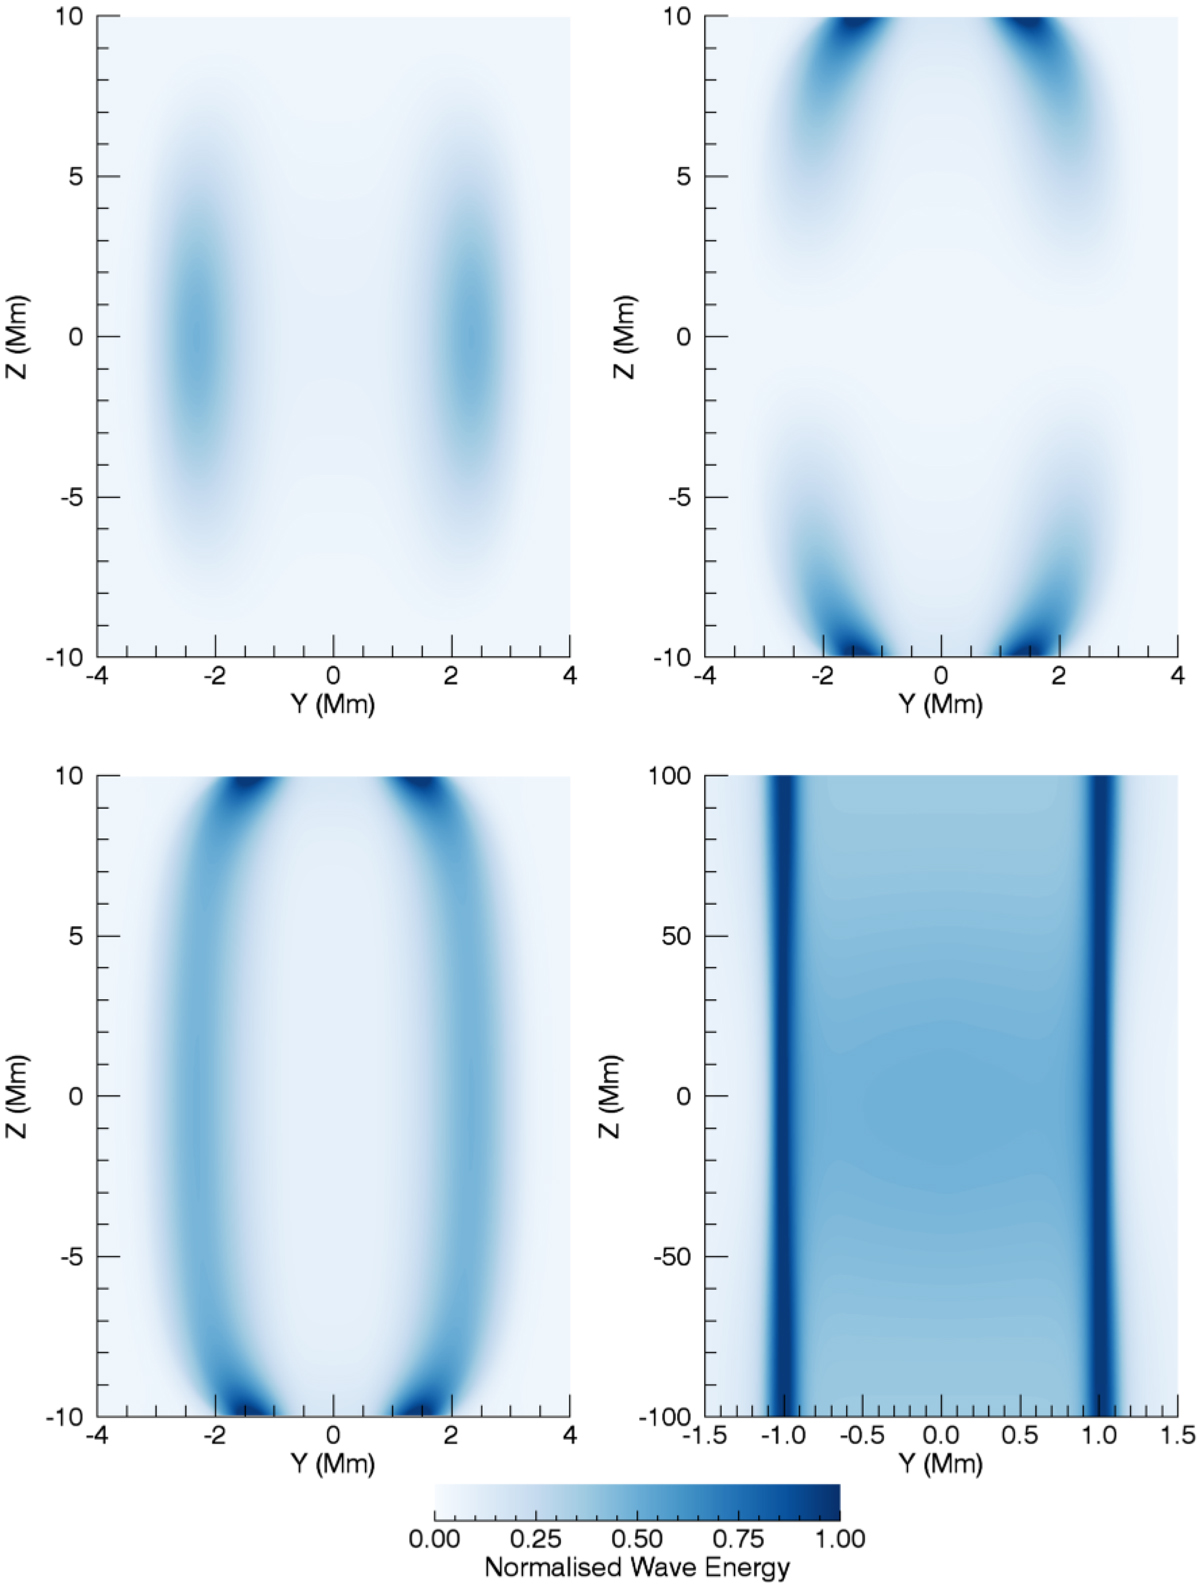
Vertical cuts through the loop axis showing the vertical structure of the Alfvén wave. Upper two panels: kinetic (left) and magnetic (right) wave energy, integrated in time over a full period. Lower left panel: sum of the two components of wave energy and lower right panel: analogous plot using data from straight field (no magnetic field expansion) experiments. In each case, we have normalised using the total Alfvén wave energy present in the respective simulation.
Current usage metrics show cumulative count of Article Views (full-text article views including HTML views, PDF and ePub downloads, according to the available data) and Abstracts Views on Vision4Press platform.
Data correspond to usage on the plateform after 2015. The current usage metrics is available 48-96 hours after online publication and is updated daily on week days.
Initial download of the metrics may take a while.