Fig. 1.
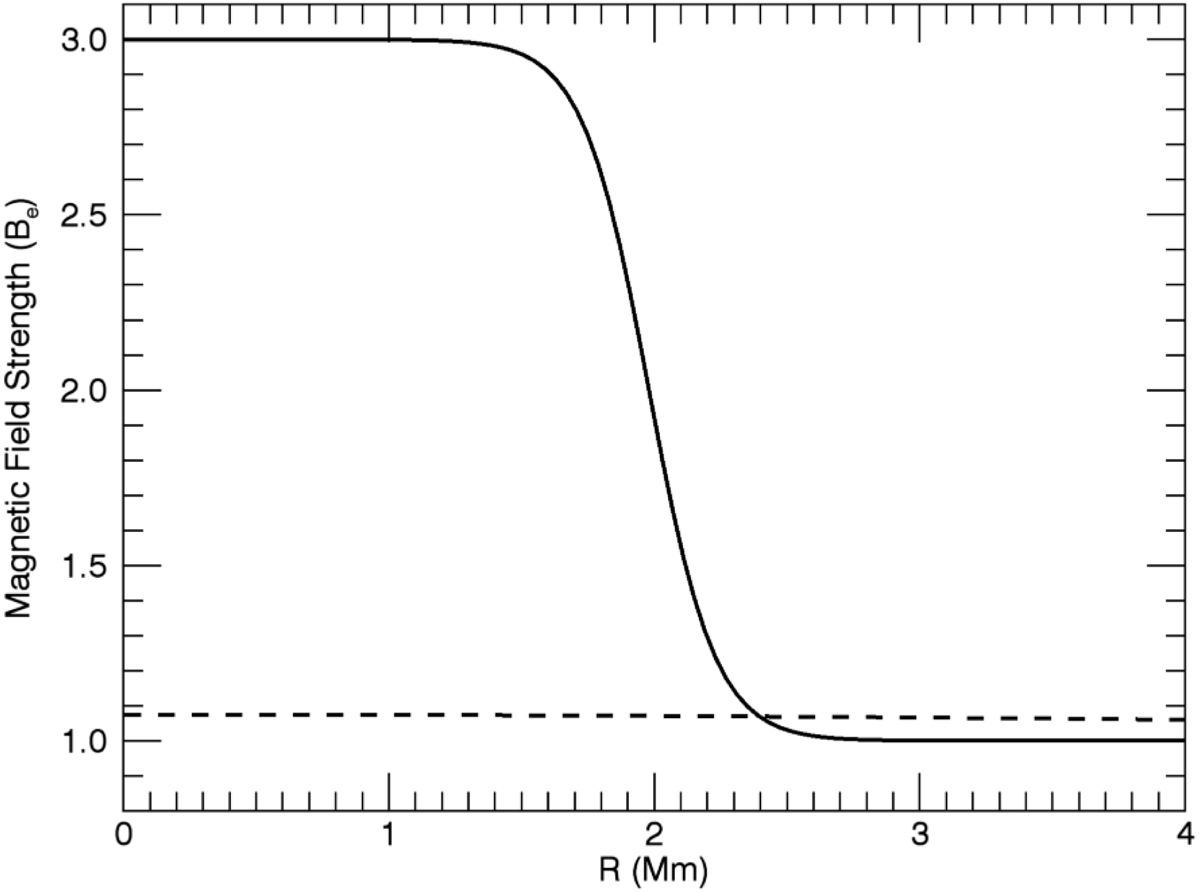
Initial magnetic field strength profile through the cross-section of the loop. The solid line shows the pre-relaxation field profile and the post-relaxation field profile at both of the z boundaries. The dashed line shows the field profile at the loop apex following the relaxation. In both cases we have normalised by the initial external field strength and note that the entire radial extent of the domain is not included within this figure.
Current usage metrics show cumulative count of Article Views (full-text article views including HTML views, PDF and ePub downloads, according to the available data) and Abstracts Views on Vision4Press platform.
Data correspond to usage on the plateform after 2015. The current usage metrics is available 48-96 hours after online publication and is updated daily on week days.
Initial download of the metrics may take a while.