Fig. 9
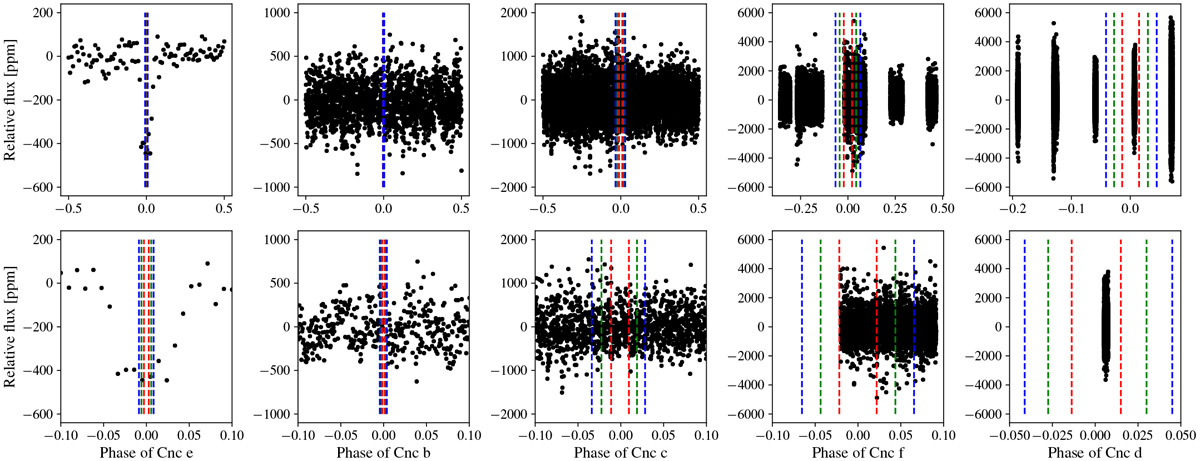
From left to right: light curves binned into 5-min intervals, phase folded at the orbital period of planet e, b, c, f, and d. The vertical lines indicate the 1, 2, and 3σ uncertainties of the time of mid-transit (red, green, and blue, respectively). Bottom panels: zoomed-in views of the mid-time transit event for each planet.
Current usage metrics show cumulative count of Article Views (full-text article views including HTML views, PDF and ePub downloads, according to the available data) and Abstracts Views on Vision4Press platform.
Data correspond to usage on the plateform after 2015. The current usage metrics is available 48-96 hours after online publication and is updated daily on week days.
Initial download of the metrics may take a while.