Fig. 6
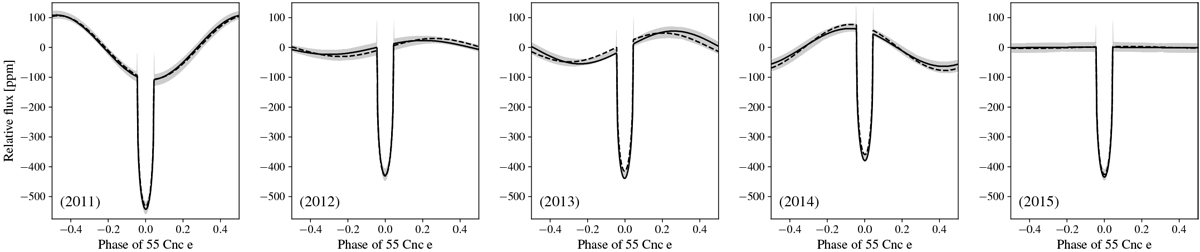
Best-fitting models resulting from the MCMC analysis as described in Sect. 4, using the light curves detrended by the classical (solid) and time-shift (dashed) procedures. For the latter only, we display the 1σ uncertainties (gray shaded area). These uncertainties have been evaluated using 104 transit models generated using transit and phase modulation parameters randomly taken from the MCMC posteriors.
Current usage metrics show cumulative count of Article Views (full-text article views including HTML views, PDF and ePub downloads, according to the available data) and Abstracts Views on Vision4Press platform.
Data correspond to usage on the plateform after 2015. The current usage metrics is available 48-96 hours after online publication and is updated daily on week days.
Initial download of the metrics may take a while.