Fig. 4
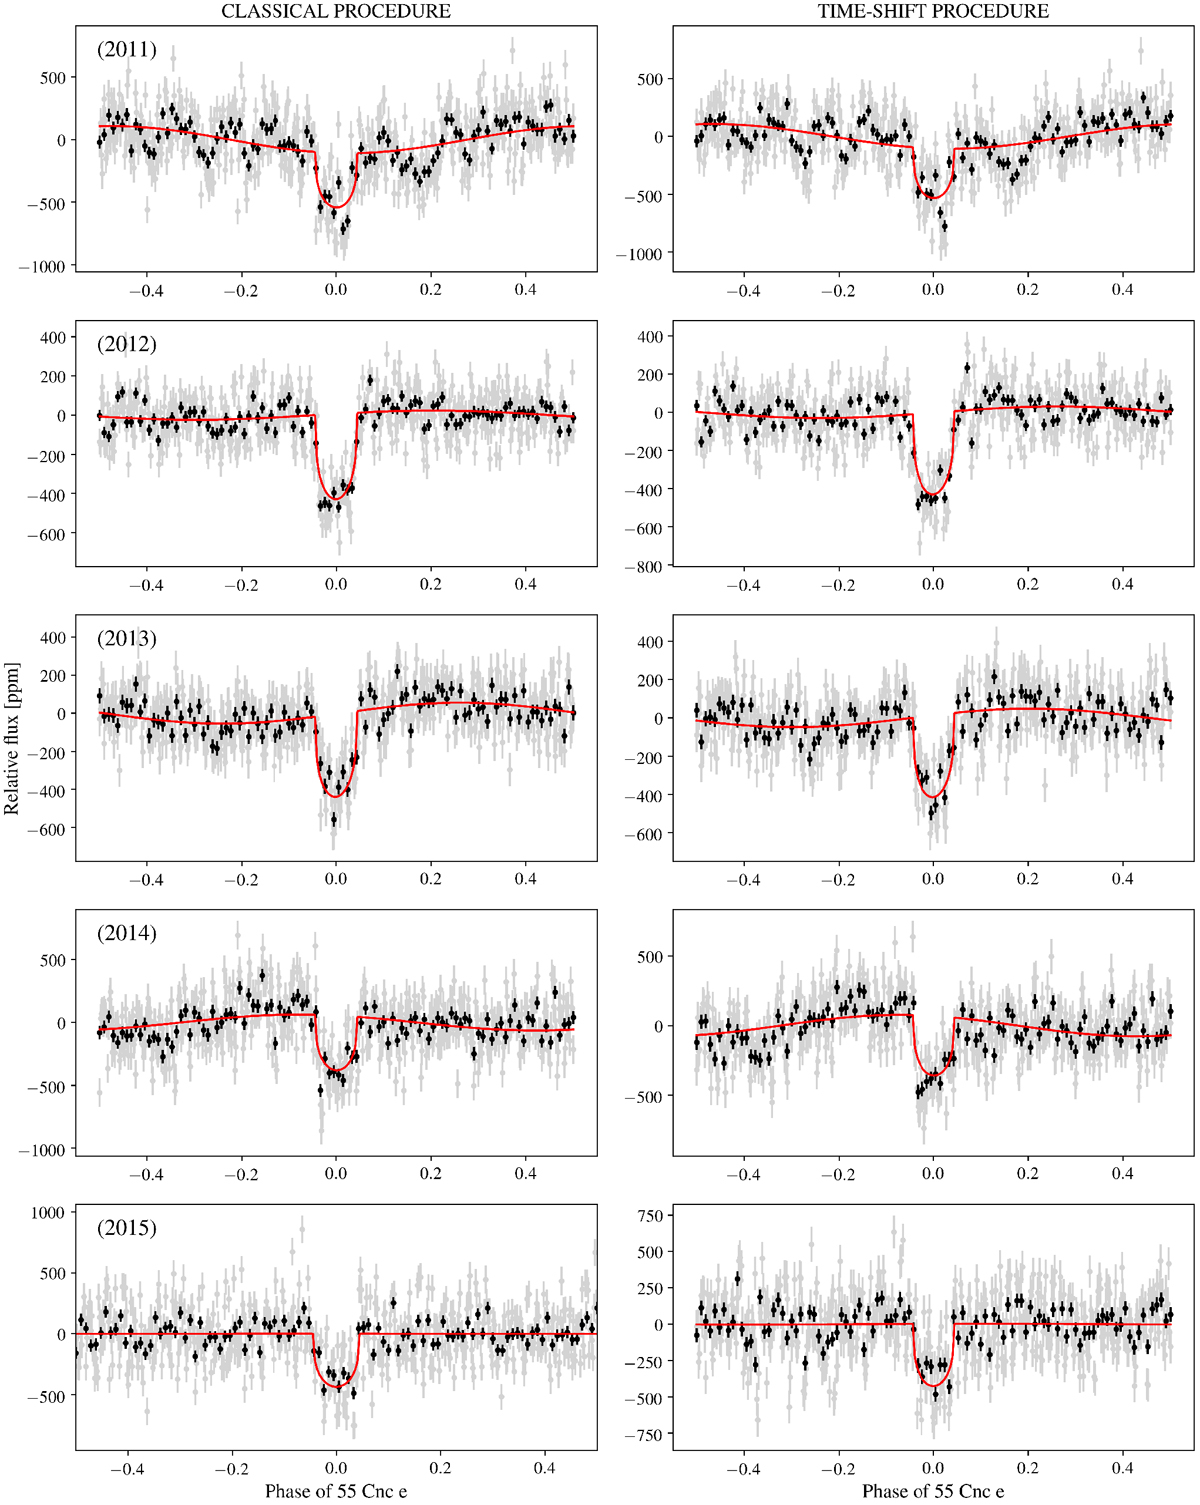
Light curves phase folded at the planet orbital period and binned into 2 (gray) and 10-min (black) intervals. From top to bottom: data taken in 2011, 2012, 2013, 2014, and 2015. First column: final light curves obtained viathe classical detrending procedure and the second column shows the light curves obtained via the time-shift detrending procedure. In these plots, the uncertainties are based on the original unscaled photometric uncertainties (in contrast to the scaled errors used in the MCMC analyses, see Sect. 4.4). The best-fitting models are shown in red.
Current usage metrics show cumulative count of Article Views (full-text article views including HTML views, PDF and ePub downloads, according to the available data) and Abstracts Views on Vision4Press platform.
Data correspond to usage on the plateform after 2015. The current usage metrics is available 48-96 hours after online publication and is updated daily on week days.
Initial download of the metrics may take a while.