Fig. 3
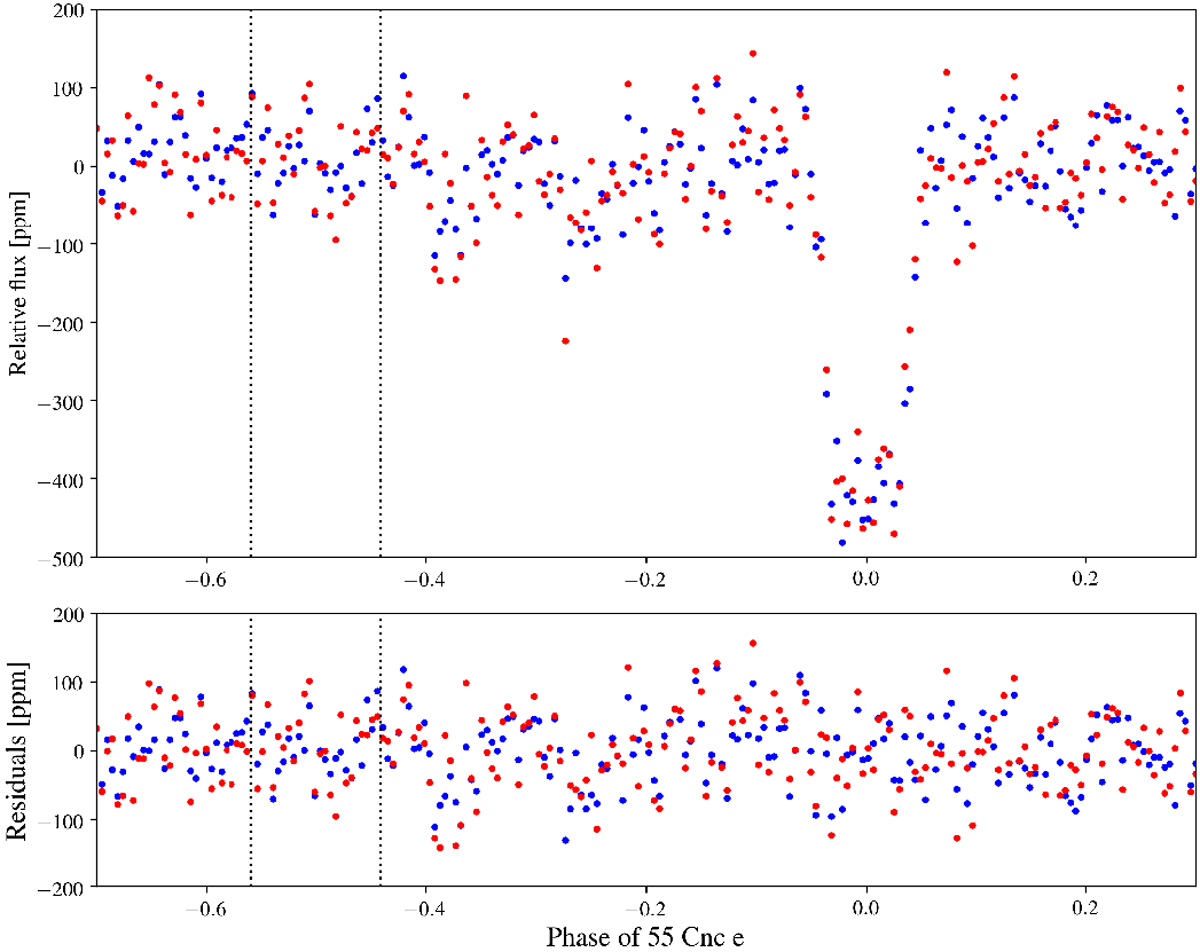
Combine light curve phase folded at the planet orbital period and binned into 5-min intervals (top) and associated residuals (bottom). The observed phase modulation has been removed using results given in Sect. 4.2 to compare only the transit shape. Observations detrendedby the classical procedure are shown in blue and by the time-shift procedure in red. At the timescale of the planet orbital period, the light curves are globally identical (S∕N ~ 40, rms ~ 1000 ppm). The phase range of the secondary eclipse are indicated by the vertical dotted lines.
Current usage metrics show cumulative count of Article Views (full-text article views including HTML views, PDF and ePub downloads, according to the available data) and Abstracts Views on Vision4Press platform.
Data correspond to usage on the plateform after 2015. The current usage metrics is available 48-96 hours after online publication and is updated daily on week days.
Initial download of the metrics may take a while.