Fig. 2

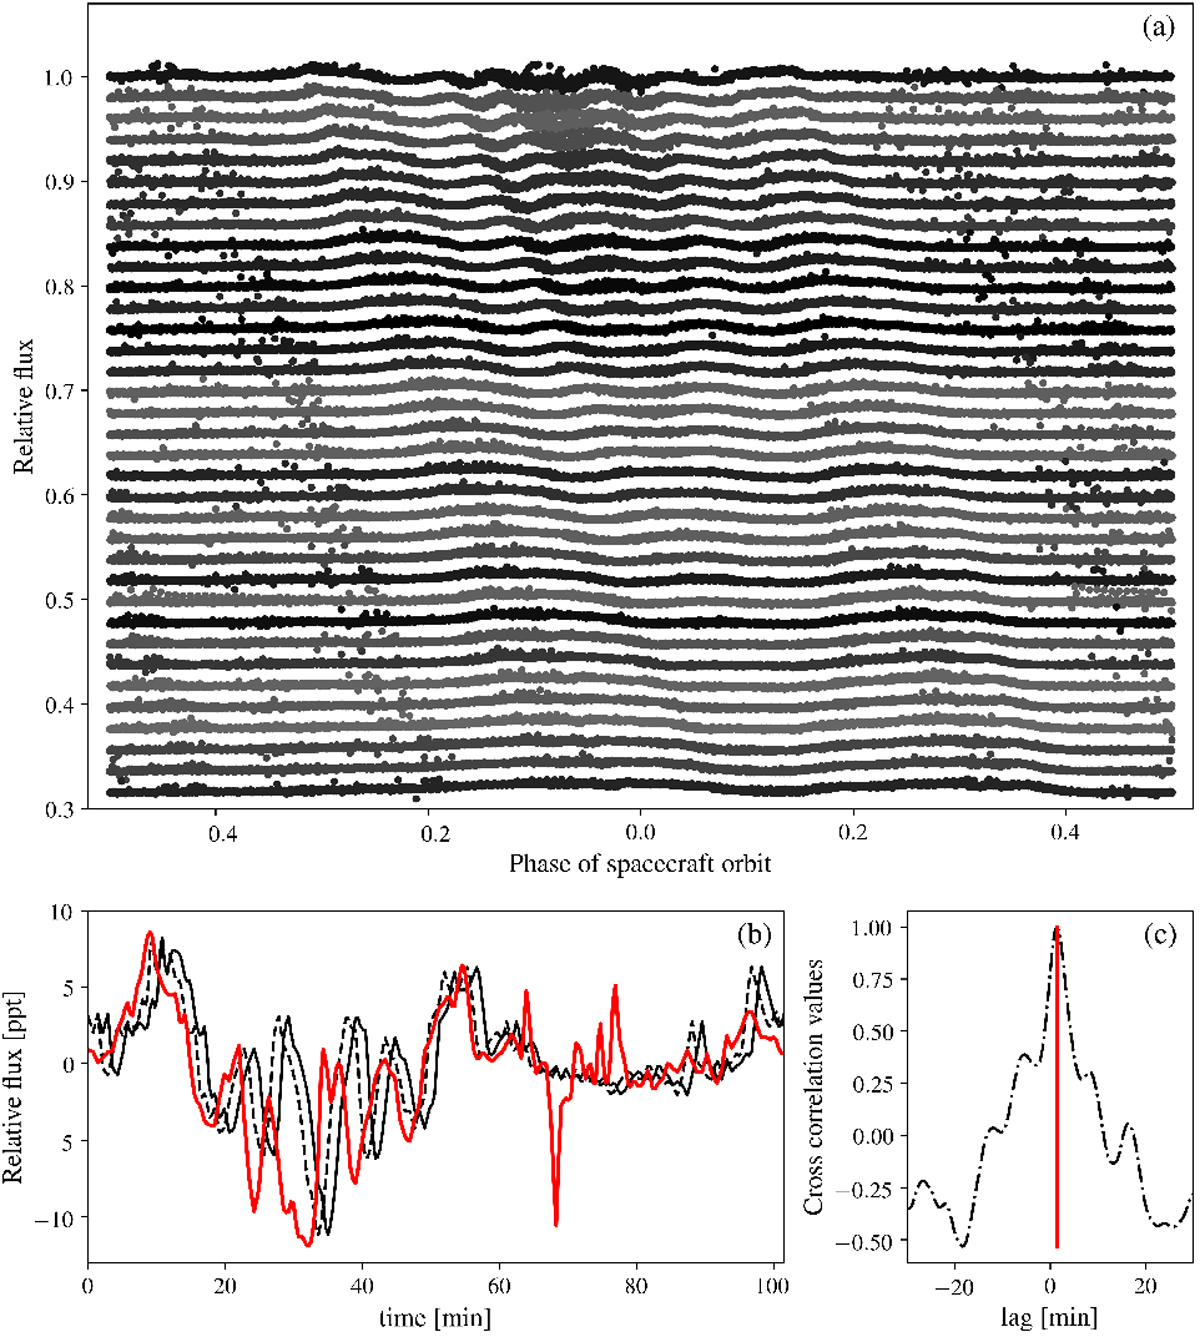
Illustration of the Earth stray-light variation with respect to the orbital period of the satellite (2012 dataset). (a) Relative flux of the one-day sequences phase folded at the MOST satellite period and binned over 5-min intervals. The different series have been shifted in flux for visibility. The shape of the stray-light evolves from day-to-day and a time delay is observed. (b) Example of patterns with a duration of one satellite period belonging to the same one-day time series. The y-axis is in part-per-thousand. The solid lines show an unshifted (black) and the reference (red) pattern. The dashed line shows the black pattern corrected by the estimated time delay (− 86s), which was found using the cross-correlation function shown in (c).
Current usage metrics show cumulative count of Article Views (full-text article views including HTML views, PDF and ePub downloads, according to the available data) and Abstracts Views on Vision4Press platform.
Data correspond to usage on the plateform after 2015. The current usage metrics is available 48-96 hours after online publication and is updated daily on week days.
Initial download of the metrics may take a while.


