Fig. A.1
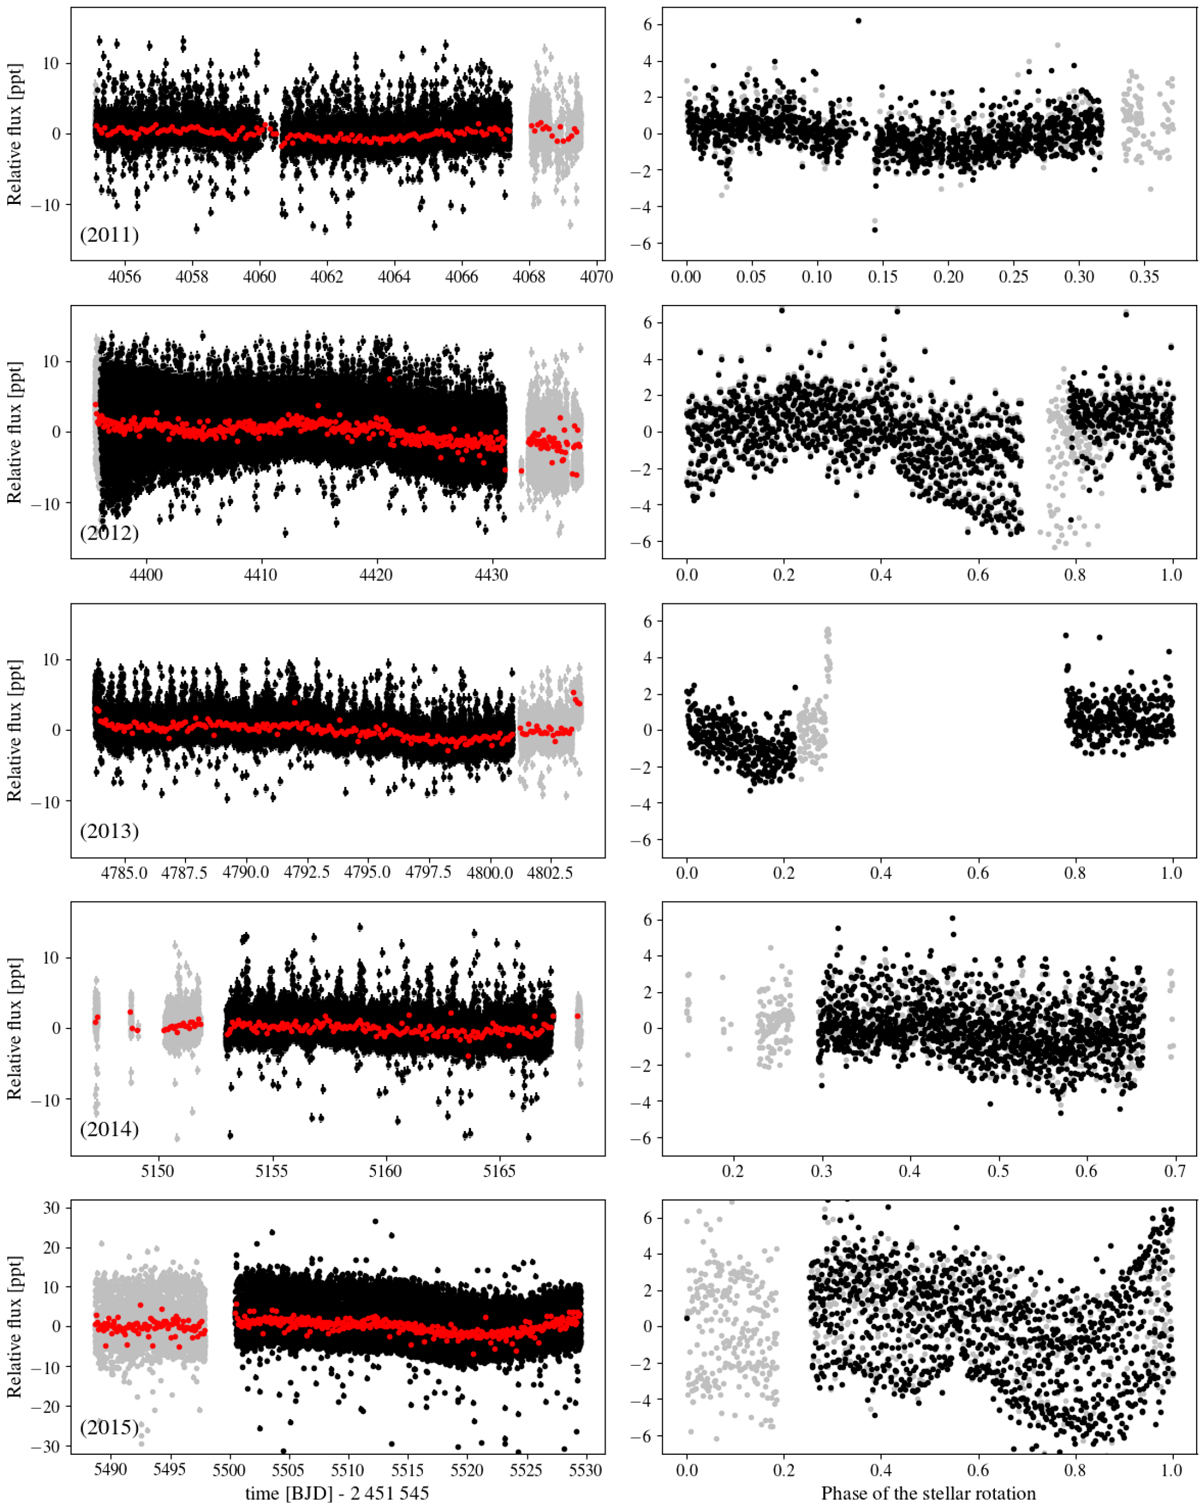
From top to bottom: light curves taken in 2011–2015 obtained before the long-term variation correction in the pre-whitening stage (see Sect. 3.1). The y-axis is in part-per-thousand. The removed sections of the light curves are shown in gray. Left column panels: represent the light curve as a function of time. The long-term variation is well observed on the data binned at two-hour intervals (red). Right column panels: represent these flux phase folded at the stellar rotation period of 38.8 days (binnedinto 30-min intervals). We note the different scale on the y-axis of the 2015 plot on the bottom.
Current usage metrics show cumulative count of Article Views (full-text article views including HTML views, PDF and ePub downloads, according to the available data) and Abstracts Views on Vision4Press platform.
Data correspond to usage on the plateform after 2015. The current usage metrics is available 48-96 hours after online publication and is updated daily on week days.
Initial download of the metrics may take a while.