Fig. 12
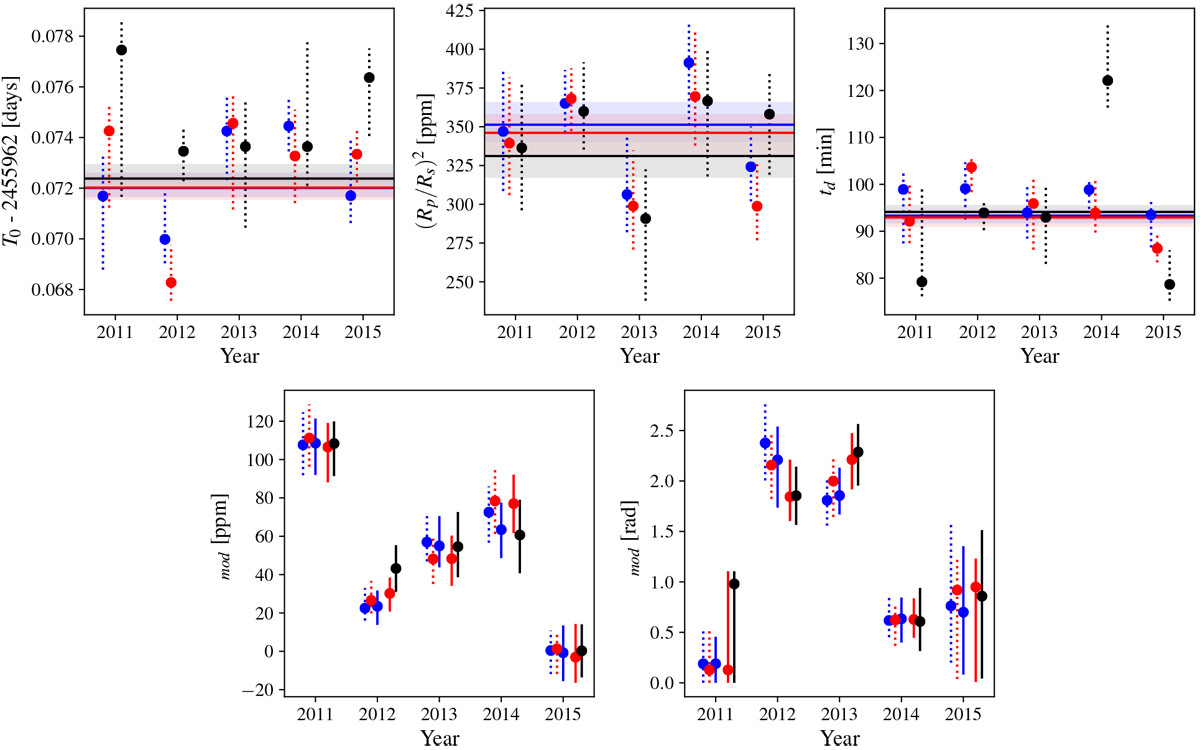
From left to right: estimated parameters of the 55 Cnc e transit (T0,
![]() , td) and of the modulation in flux (αmod and ϕmod). In all panels, dotted points indicate the best-fitting values derived from each of the 5 MOST data analyzed separately using the classical and time-shift detrending procedures and values obtained using the light curve not corrected for the stray-light systematics (i.e., resulting only from the pre-whitening step; see Sect. 3.1). In the three first panels, the horizontal solid lines represent the values derived from the combined light curves (see Table 3 and Sect. 4.1) with their 1σ uncertainties (shaded area). In the two last panels, the solid points represent the modulation parameters derived during the analysis of these combined light curves (see Table 4 and Sect. 4.2).
, td) and of the modulation in flux (αmod and ϕmod). In all panels, dotted points indicate the best-fitting values derived from each of the 5 MOST data analyzed separately using the classical and time-shift detrending procedures and values obtained using the light curve not corrected for the stray-light systematics (i.e., resulting only from the pre-whitening step; see Sect. 3.1). In the three first panels, the horizontal solid lines represent the values derived from the combined light curves (see Table 3 and Sect. 4.1) with their 1σ uncertainties (shaded area). In the two last panels, the solid points represent the modulation parameters derived during the analysis of these combined light curves (see Table 4 and Sect. 4.2).
Current usage metrics show cumulative count of Article Views (full-text article views including HTML views, PDF and ePub downloads, according to the available data) and Abstracts Views on Vision4Press platform.
Data correspond to usage on the plateform after 2015. The current usage metrics is available 48-96 hours after online publication and is updated daily on week days.
Initial download of the metrics may take a while.