Fig. 11
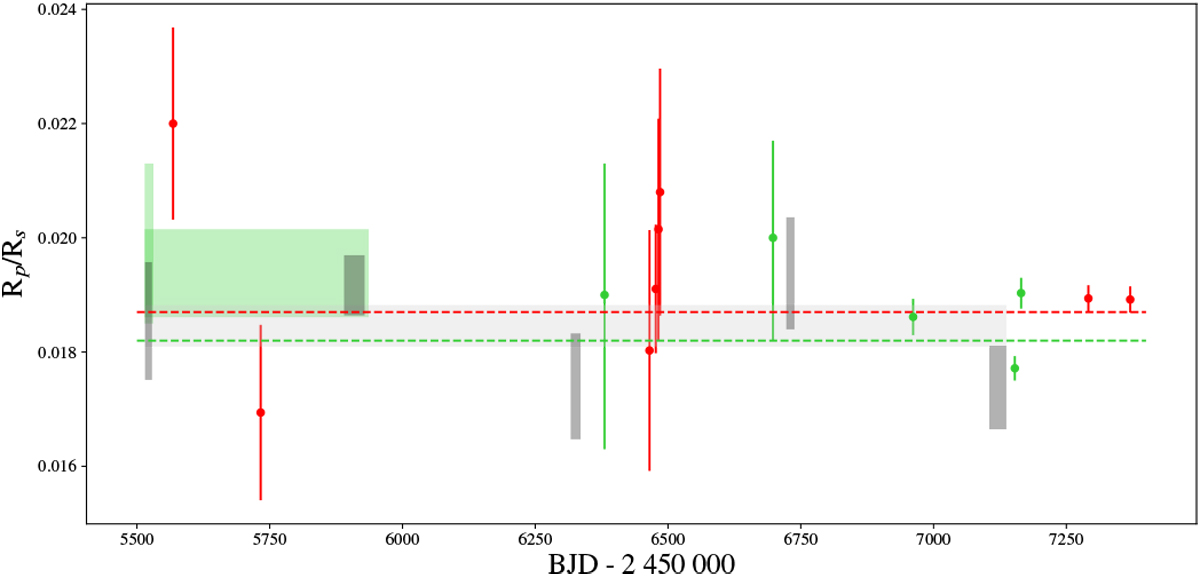
Reproduction of Fig. 15 of Bourrier et al. (2018a) representing the planet-to-star radius ratio measured over time with various instruments. Observations in the optical are shown in green. Chronologically, we show values from Gillon et al. (2012) and D14 with MOST; from de Mooij et al. (2014) with Alhambra Faint Object Spectrograph and Camera (ALFOSC) and from Bourrier et al. (2018a) with the Space Telescope Imaging Spectrograph (STIS) spectrograph onboard the Hubble Space Telescope (HST). Our measurements derived from MOST and resulting from the time-shift procedure are shown in black (individual points and combined light curves). Observations in IR are represented in red: Demory et al. (2016a) with Spitzer and Tsiaras et al. (2016) with Wide Field Camera 3 (WFC3) onboard HST. Following Bourrier et al. (2018a), the dashed green line shows the value obtained from the fit to the three combined STIS visits and the dashed red line shows the value obtained from the fit to the combined Spitzer visits (Demory et al. 2016b). The values represented by rectangles indicate radius ratios that have been estimated over an extended period of time.
Current usage metrics show cumulative count of Article Views (full-text article views including HTML views, PDF and ePub downloads, according to the available data) and Abstracts Views on Vision4Press platform.
Data correspond to usage on the plateform after 2015. The current usage metrics is available 48-96 hours after online publication and is updated daily on week days.
Initial download of the metrics may take a while.