Fig. 10
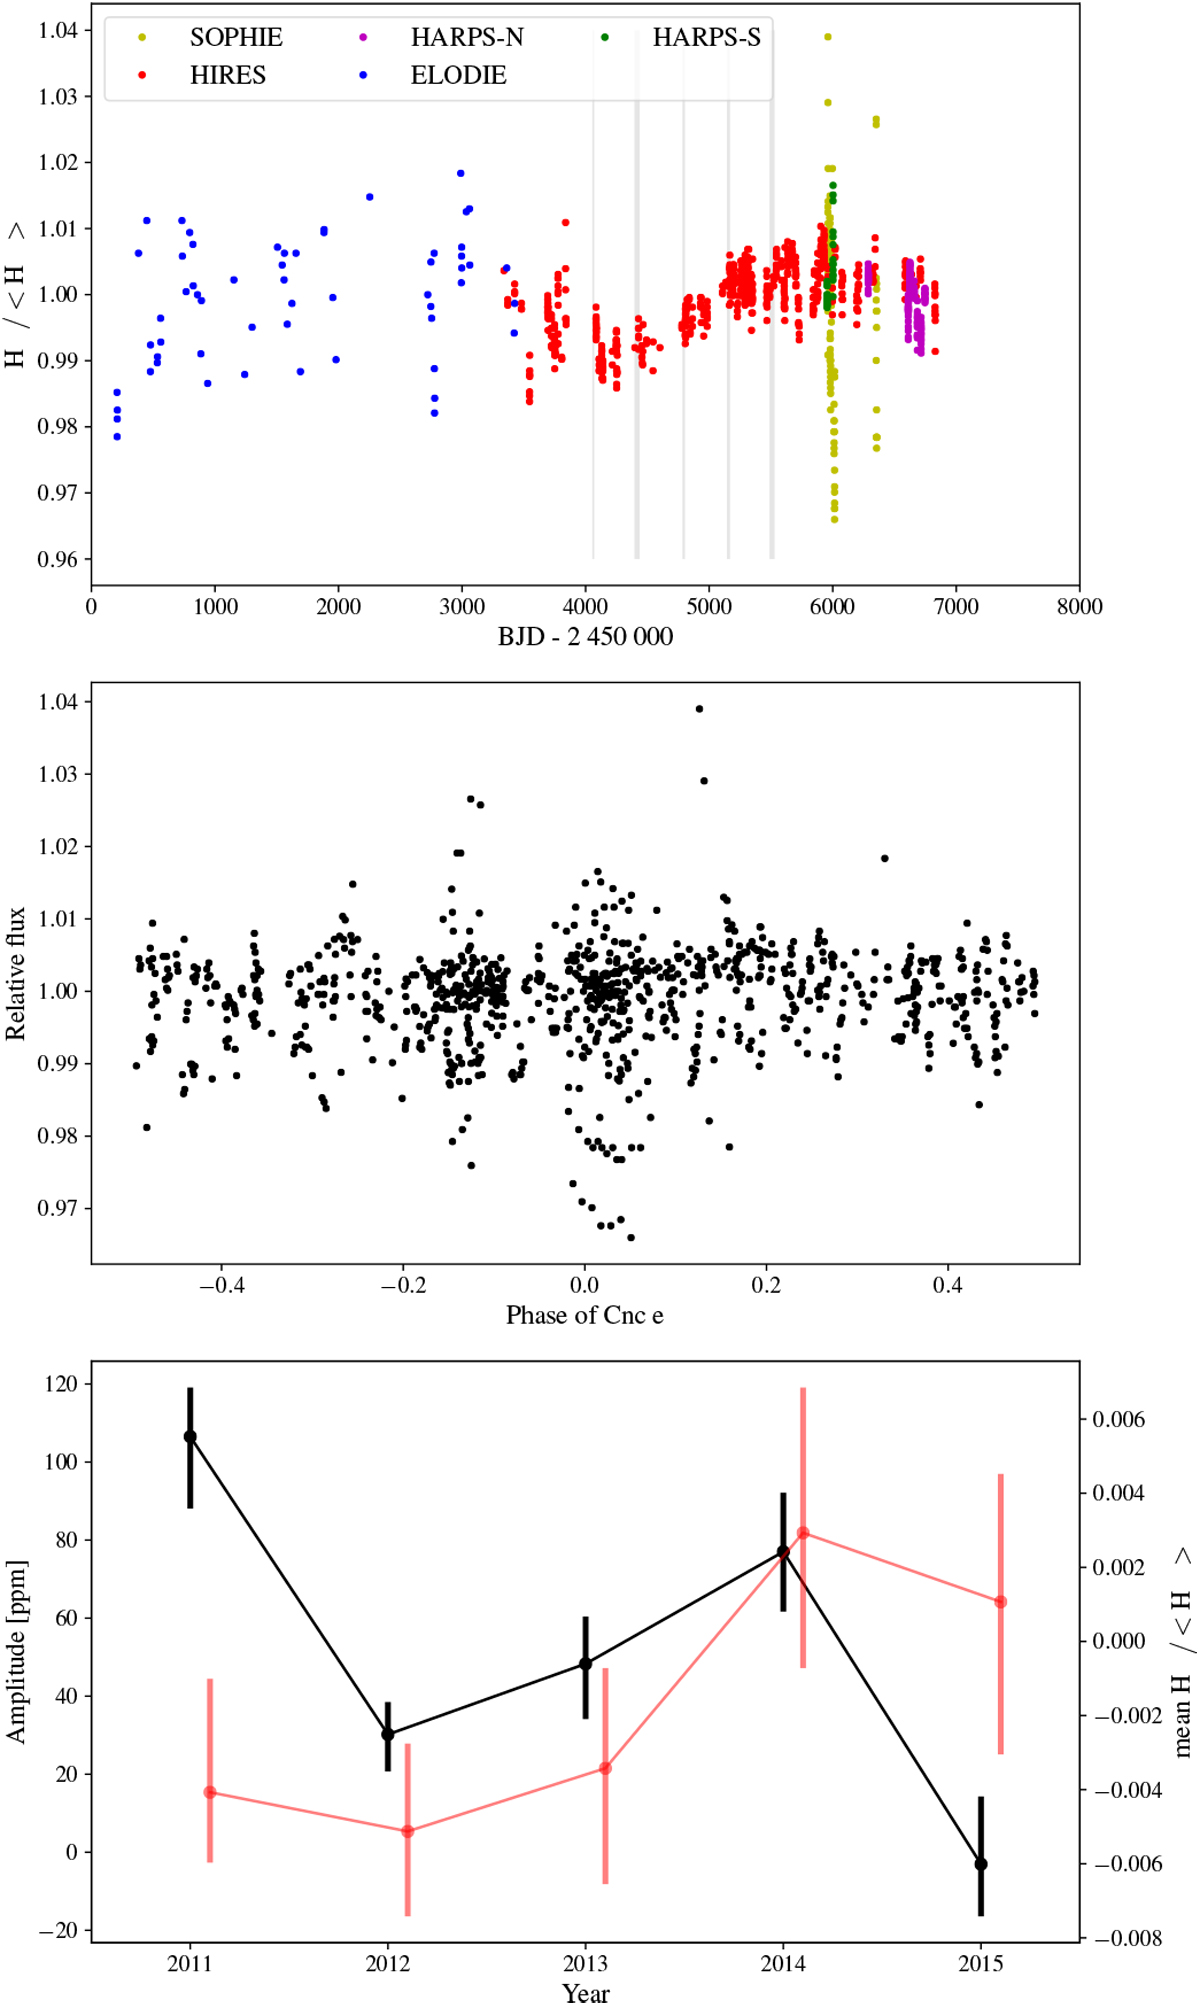
Top: H-α activity index of the 55 Cnc A star (see Fig. 2 of Bourrier et al. 2018a, second panel) and MOST observations dates (gray). Middle: combined H-α data phase folded at the planet orbital period. Bottom: amplitudes of the modulation (see Table 4) measured on MOST observations (black, left y-axis) and mean values of the H-α stellar activity indicator (red, right y-axis) evaluated around dates close to the MOST observations. The error bars on the mean H-α values are taken as the minimum and maximum values of the index in the considered year. We note the H-α values have been slightly shifted in time for visibility. We observe the increase/decrease of the modulation in phase with the increase/decrease of the stellar activity indicator.
Current usage metrics show cumulative count of Article Views (full-text article views including HTML views, PDF and ePub downloads, according to the available data) and Abstracts Views on Vision4Press platform.
Data correspond to usage on the plateform after 2015. The current usage metrics is available 48-96 hours after online publication and is updated daily on week days.
Initial download of the metrics may take a while.