Fig. 1
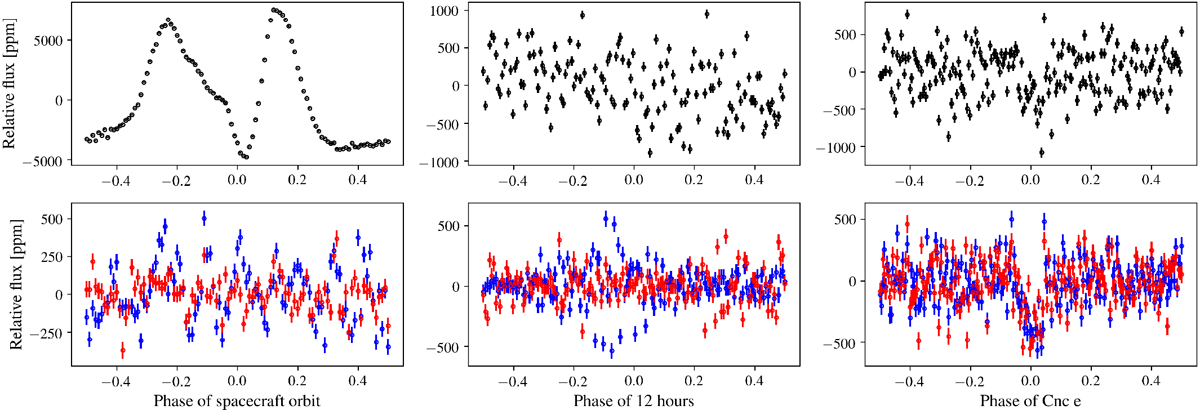
MOST data obtained in 2015 after pre-whitening (top panels, see Sect. 3.1) and after the correction of the Earth stray-light variations (bottom panels, see Sect. 3.2). We show the relative flux phase folded at the satellite period (left, binned into 1 min), a period of 12 h (middle, binned into 5 min), and the planet period (right, binned into 5 min). In the bottom panels, observations detrended by the classical procedure (see Sect. 3.2.1) are shown in blue and by the time-shift procedure (see Sect. 3.2.2) in red. In these plots, the uncertainties are based on the original unscaled photometric uncertainties.
Current usage metrics show cumulative count of Article Views (full-text article views including HTML views, PDF and ePub downloads, according to the available data) and Abstracts Views on Vision4Press platform.
Data correspond to usage on the plateform after 2015. The current usage metrics is available 48-96 hours after online publication and is updated daily on week days.
Initial download of the metrics may take a while.