Fig. 7.
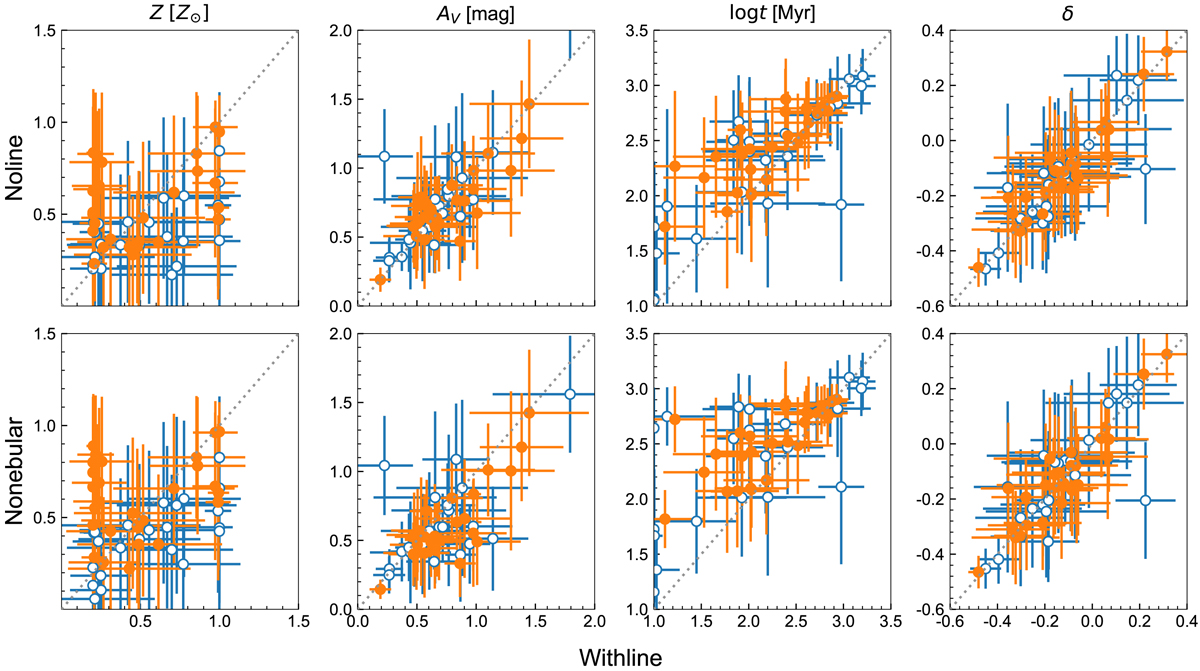
Top: comparison of the metallicity, dust attenuation, age, and δ derived from the Withline and Noline runs. Bottom: comparison of the metallicity, dust attenuation, age, and δ derived from the Withline and Nonebular runs. Orange dots are galaxies in Sample-A. Blue circles are galaxies in Sample-B. Sample-A has a better data quality than Sample-B, as defined in Sect. 3.3. The dotted line are the 1:1 line.
Current usage metrics show cumulative count of Article Views (full-text article views including HTML views, PDF and ePub downloads, according to the available data) and Abstracts Views on Vision4Press platform.
Data correspond to usage on the plateform after 2015. The current usage metrics is available 48-96 hours after online publication and is updated daily on week days.
Initial download of the metrics may take a while.