Fig. 4.
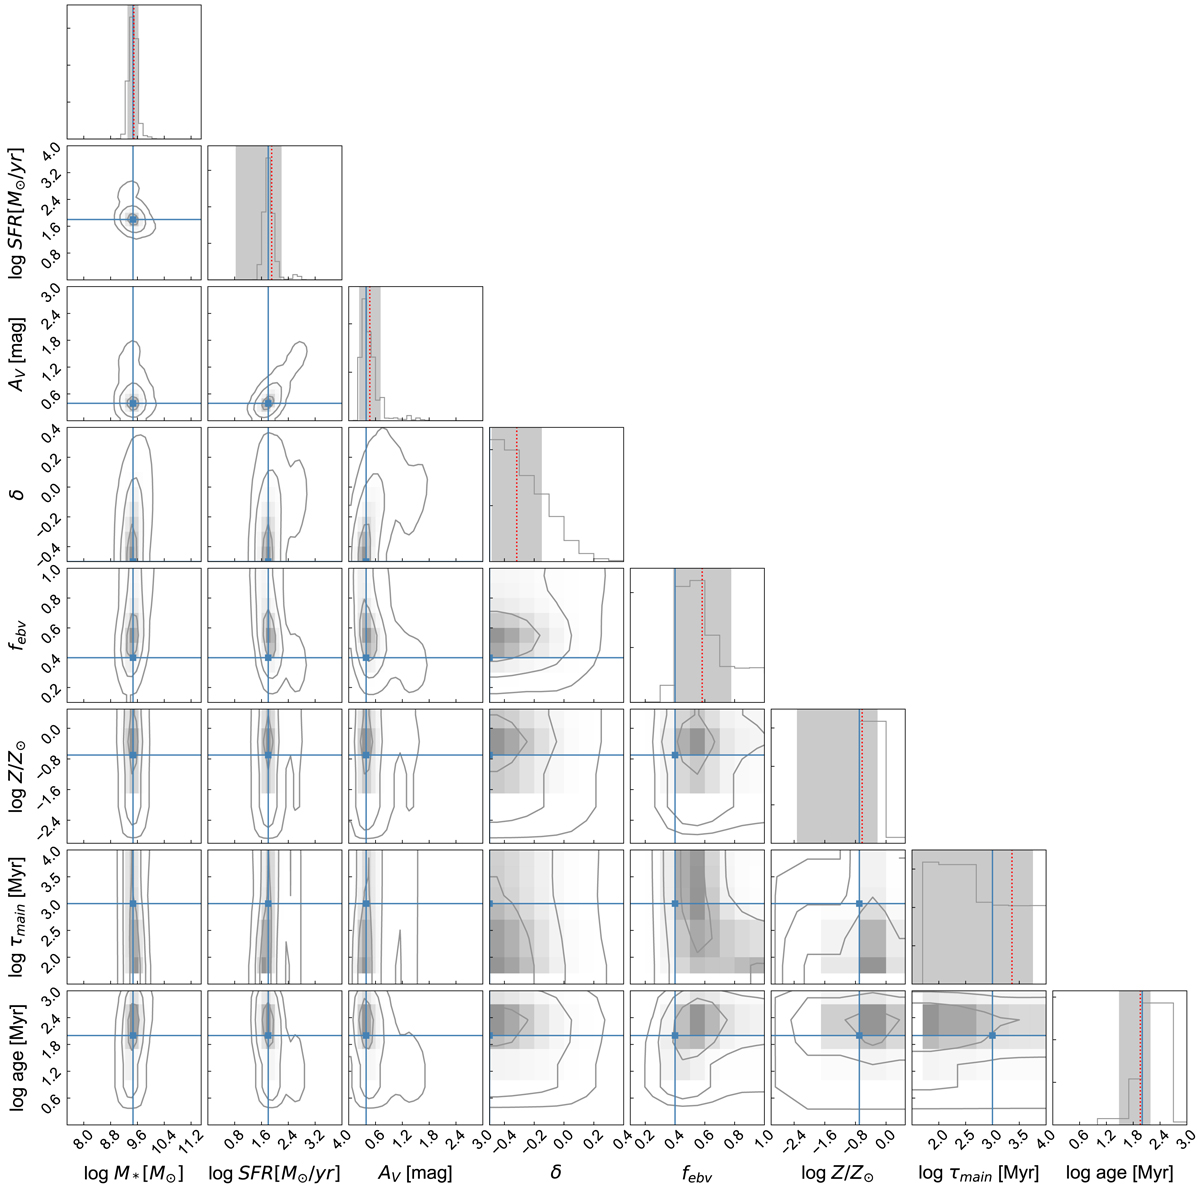
PDF corner plot for a mock galaxy with χ2 = 1.34, showing the 1D and 2D marginalized posteriors for each parameters using our Bayesian approach. The blue lines represent the true values used to generate the mock photometry. For the 1D histogram, the red dashed lines show the estimated values and the shaded regions indicate 1σ uncertainties. For the 2D plot, the different contours correspond to 1, 2, 3σ.
Current usage metrics show cumulative count of Article Views (full-text article views including HTML views, PDF and ePub downloads, according to the available data) and Abstracts Views on Vision4Press platform.
Data correspond to usage on the plateform after 2015. The current usage metrics is available 48-96 hours after online publication and is updated daily on week days.
Initial download of the metrics may take a while.