Fig. 2.
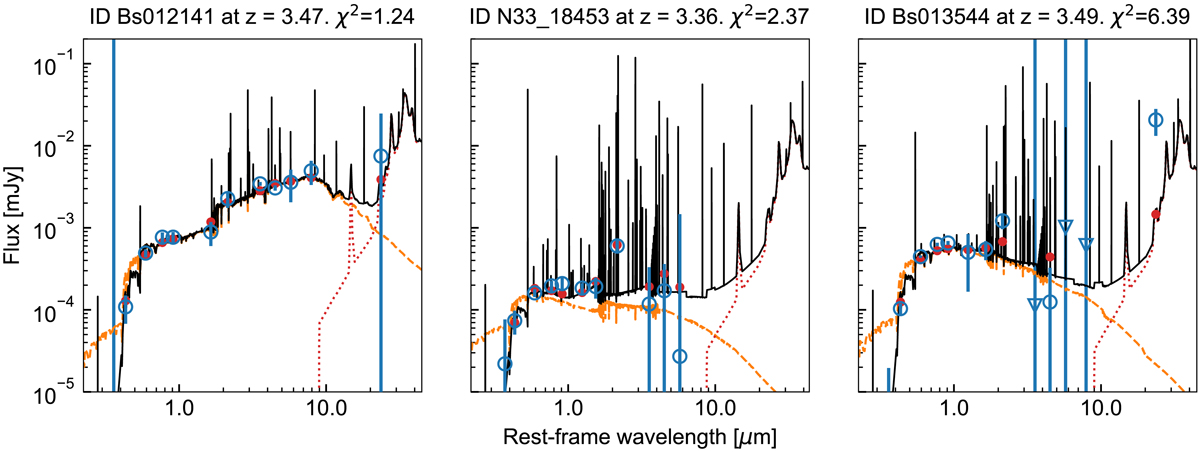
Examples of SED fit with ![]() = 1.24 (left),
= 1.24 (left), ![]() = 2.37 (middle), and
= 2.37 (middle), and ![]() = 6.39 (right). The best model from CIGALE SED fitting is shown in solid line. The observed fluxes (open circles), the model spectrum of the stellar population (dashed line), the model fluxes (dots), and the dust emission (dotted line) are overplotted. For the fit with
= 6.39 (right). The best model from CIGALE SED fitting is shown in solid line. The observed fluxes (open circles), the model spectrum of the stellar population (dashed line), the model fluxes (dots), and the dust emission (dotted line) are overplotted. For the fit with ![]() > 5 (right), the discrepancy between the observed fluxes and the best model is significant.
> 5 (right), the discrepancy between the observed fluxes and the best model is significant.
Current usage metrics show cumulative count of Article Views (full-text article views including HTML views, PDF and ePub downloads, according to the available data) and Abstracts Views on Vision4Press platform.
Data correspond to usage on the plateform after 2015. The current usage metrics is available 48-96 hours after online publication and is updated daily on week days.
Initial download of the metrics may take a while.