Fig. 4.
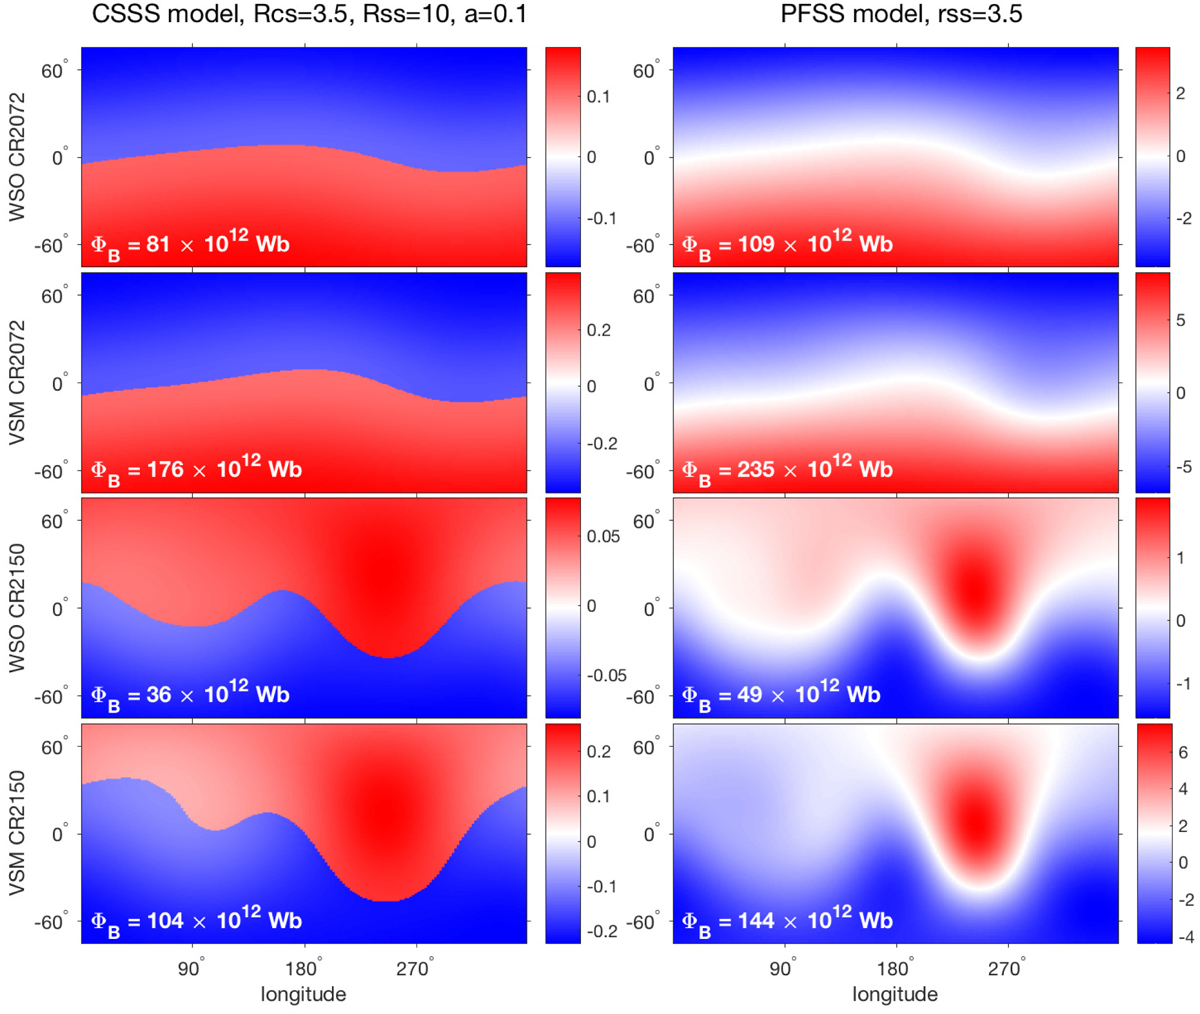
Synoptic maps of the coronal source surface field (in μT) for the CSSS model (left column) and the PFSS model (right column), using WSO (first and third rows) and SOLIS/VSM (second and fourth rows) data for Carrington rotations 2072 (July 2008) and 2150 (May 2014). The total unsigned open flux ΦB is included in white font in each panel. Both nmax and nmax, c are 9.
Current usage metrics show cumulative count of Article Views (full-text article views including HTML views, PDF and ePub downloads, according to the available data) and Abstracts Views on Vision4Press platform.
Data correspond to usage on the plateform after 2015. The current usage metrics is available 48-96 hours after online publication and is updated daily on week days.
Initial download of the metrics may take a while.