Fig. B.2.
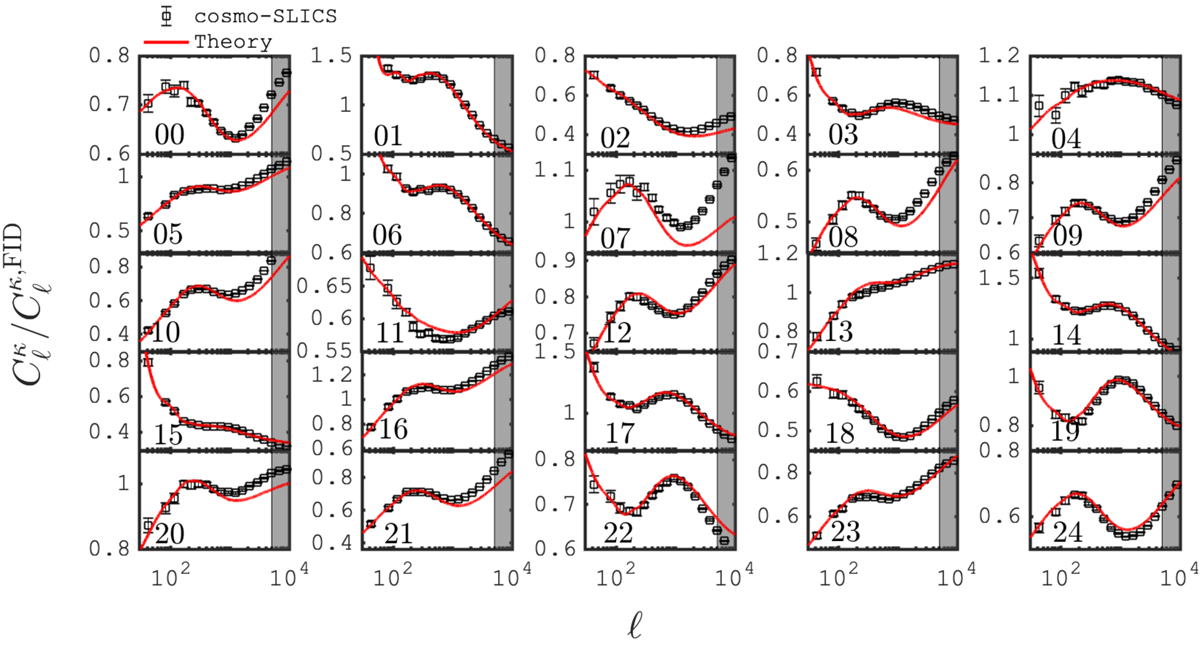
Ratio between the lensing convergence power spectra from all 25 wCDM cosmological models and that from model-FID. The symbols are from the simulations, the red lines from the theoretical predictions. These measurements show the average over the 800 pseudo-independent line-of-sights, and the error bars represent the error on the mean.
Current usage metrics show cumulative count of Article Views (full-text article views including HTML views, PDF and ePub downloads, according to the available data) and Abstracts Views on Vision4Press platform.
Data correspond to usage on the plateform after 2015. The current usage metrics is available 48-96 hours after online publication and is updated daily on week days.
Initial download of the metrics may take a while.