Fig. 14.
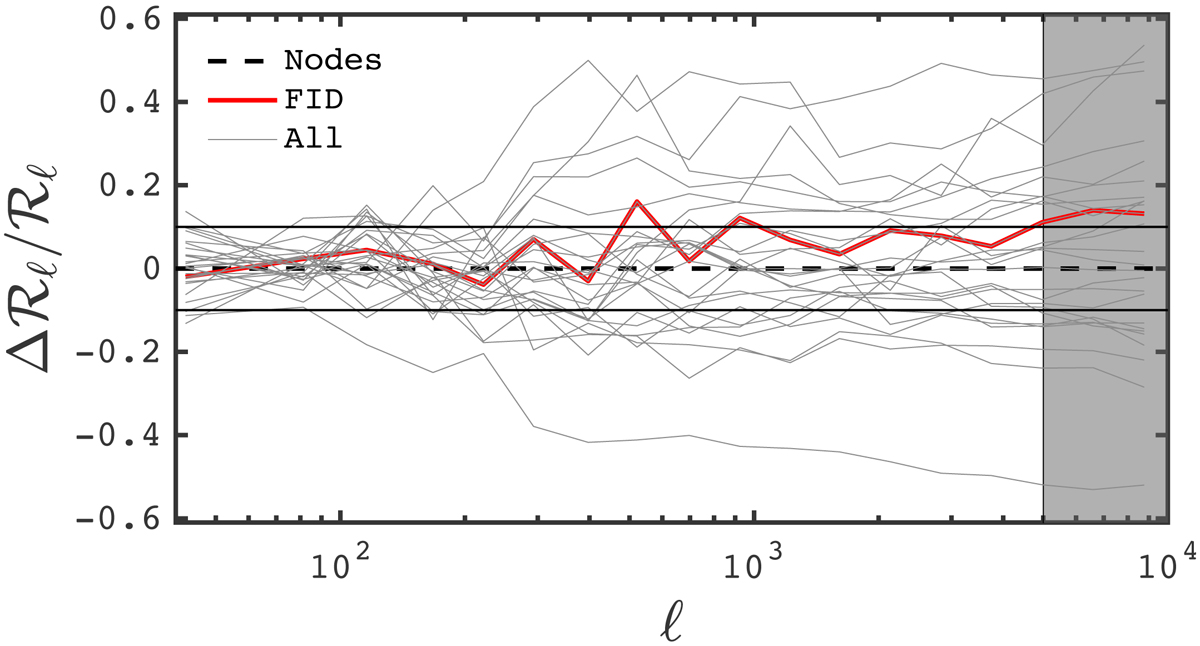
Fractional difference on ℛℓ between the measurements at the 25+1 cosmo-SLICS nodes and the interpolated predictions from our GP emulator, obtained in our “leave-one-out” cross-validation test. The thick red line represents the ΛCDM prediction after training on the wCDM models, and the thin horizontal lines indicate the ±10% range.
Current usage metrics show cumulative count of Article Views (full-text article views including HTML views, PDF and ePub downloads, according to the available data) and Abstracts Views on Vision4Press platform.
Data correspond to usage on the plateform after 2015. The current usage metrics is available 48-96 hours after online publication and is updated daily on week days.
Initial download of the metrics may take a while.