Fig. 12.
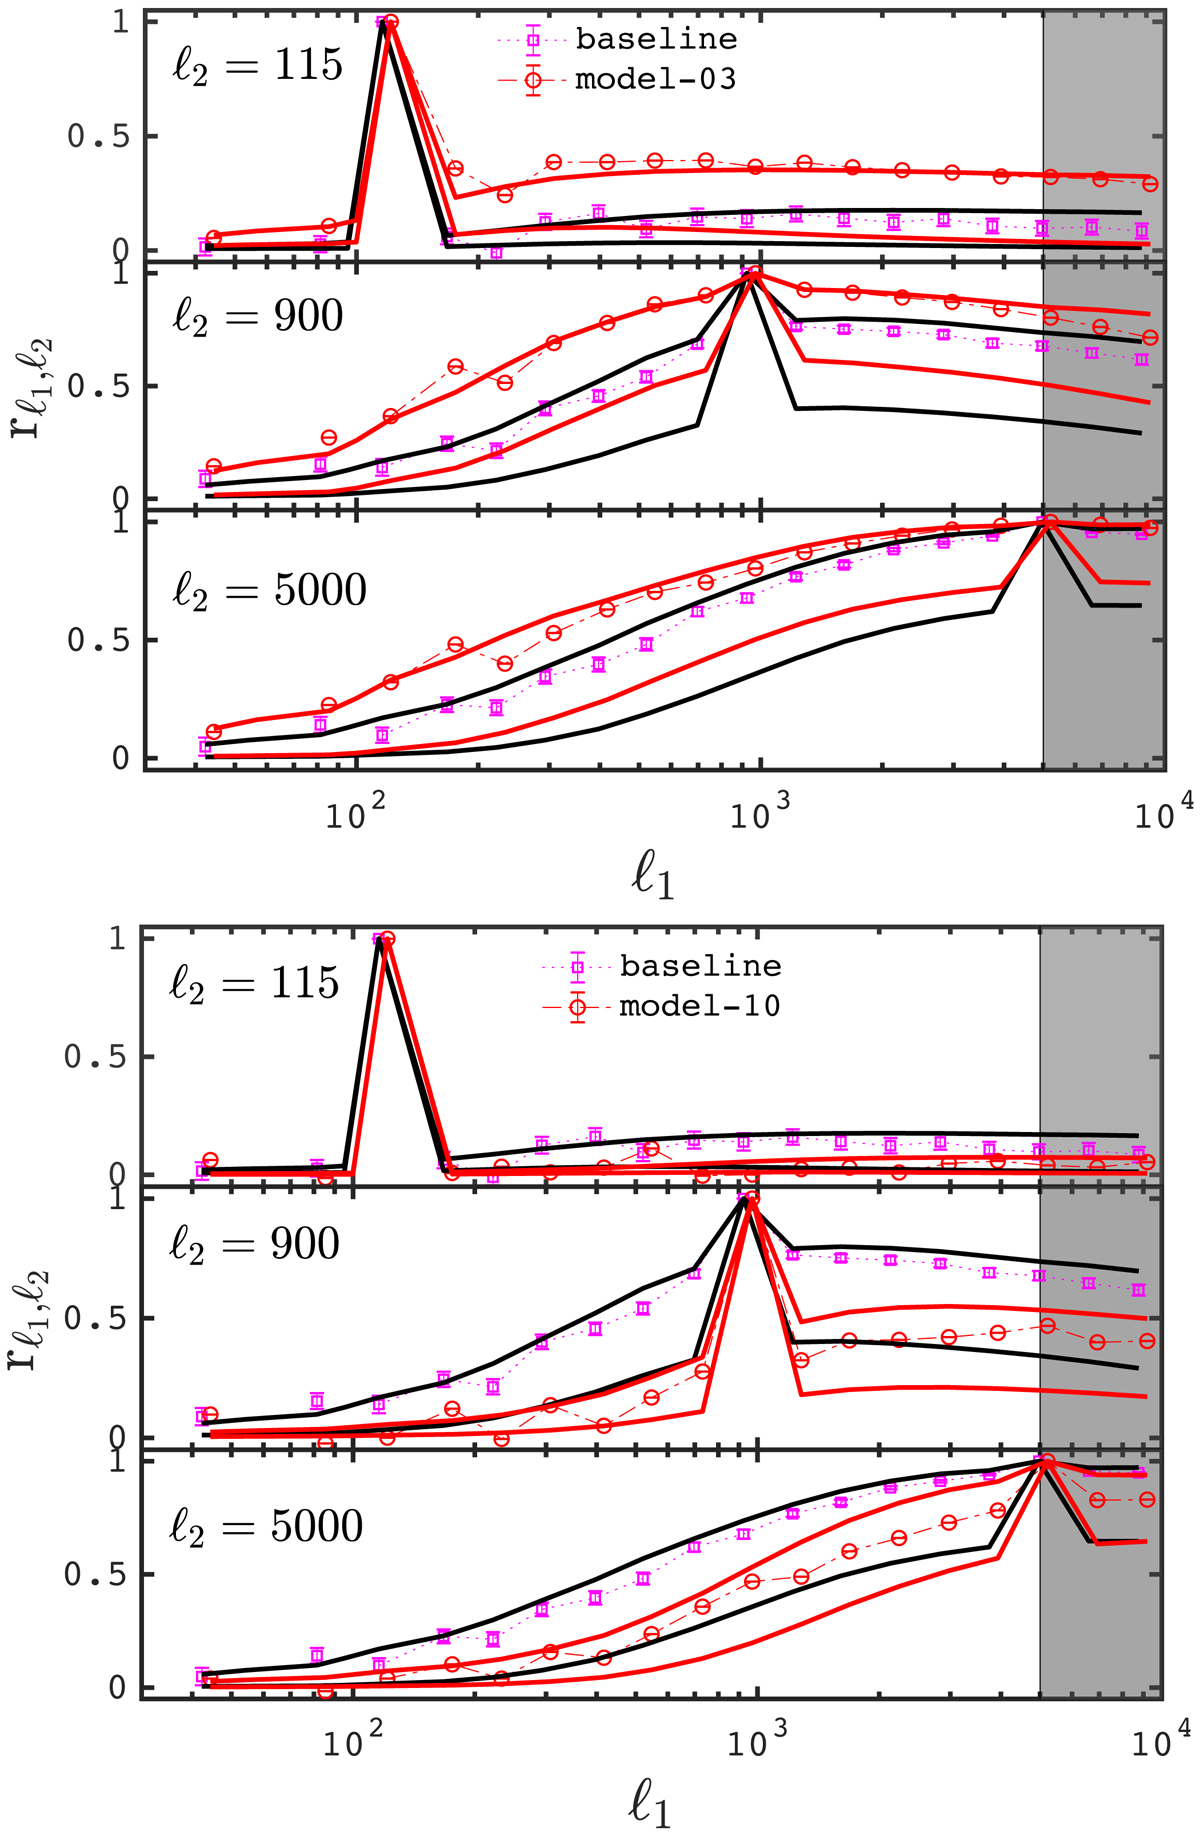
Same as Fig. 9, but for different cosmologies. The magenta squares and black lines are taken from Fig. 9 and show the baseline estimator and the analytic model at the fiducial cosmology. The red circles and red lines are from the cosmo-SLICS and the analytic predictions respectively, for model-03 (upper) and model-10 (lower). Results from all other models are similar to these.
Current usage metrics show cumulative count of Article Views (full-text article views including HTML views, PDF and ePub downloads, according to the available data) and Abstracts Views on Vision4Press platform.
Data correspond to usage on the plateform after 2015. The current usage metrics is available 48-96 hours after online publication and is updated daily on week days.
Initial download of the metrics may take a while.