Fig. 3.
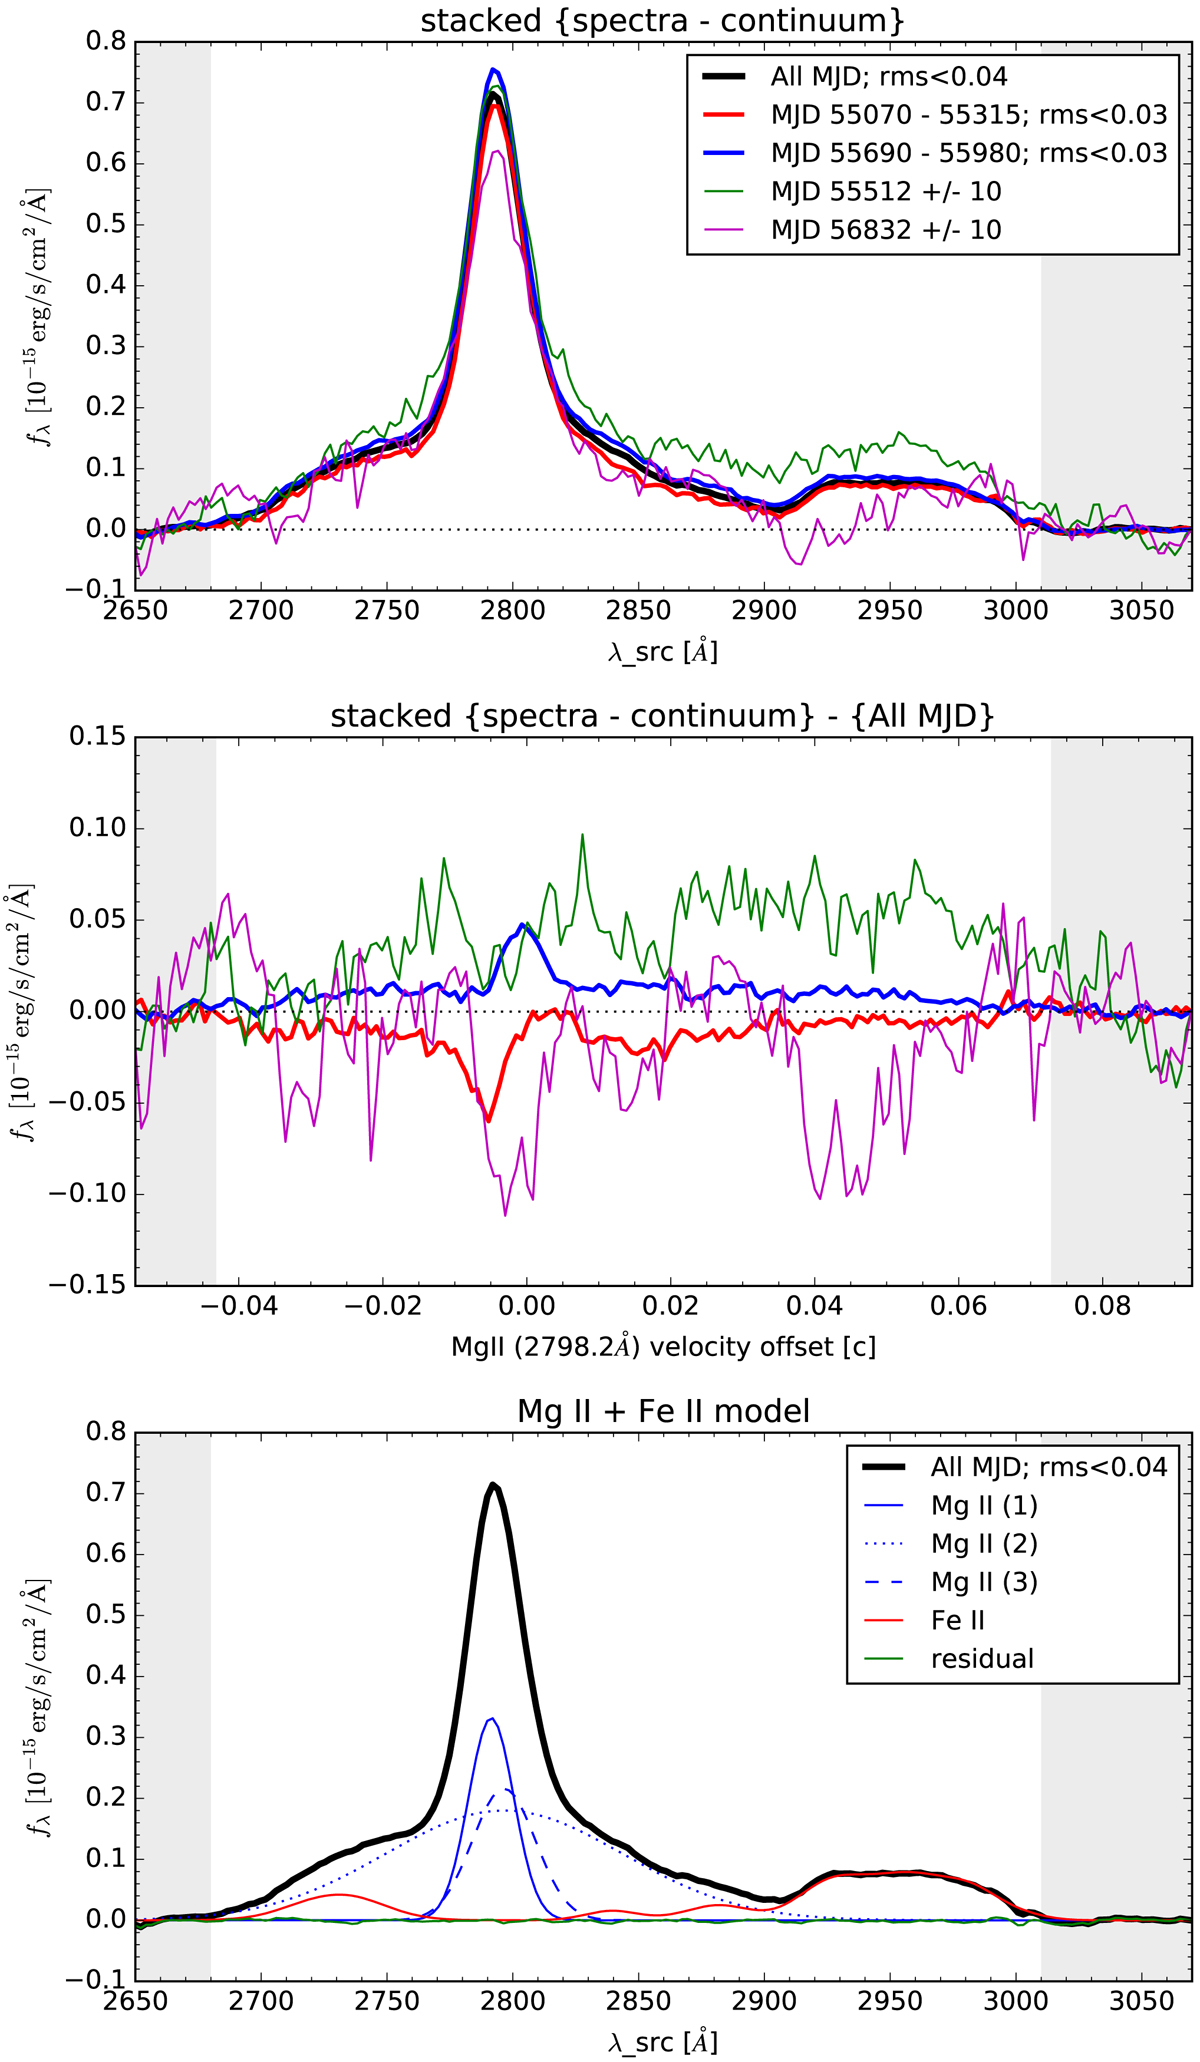
Upper panel: observed source-frame spectra stacked over different observational periods after subtraction of power-law continuum. Middle panel: differences between spectra stacked over limited observational periods and the spectrum stacked over all available observations (line styles correspond to those in the upper panel). Lower panel: model for the spectral decomposition of the Mg II line and theoretical Fe II pseudo-continuum template. The spectral windows for continuum evaluation are indicated with grey stripes.
Current usage metrics show cumulative count of Article Views (full-text article views including HTML views, PDF and ePub downloads, according to the available data) and Abstracts Views on Vision4Press platform.
Data correspond to usage on the plateform after 2015. The current usage metrics is available 48-96 hours after online publication and is updated daily on week days.
Initial download of the metrics may take a while.