Fig. 7.
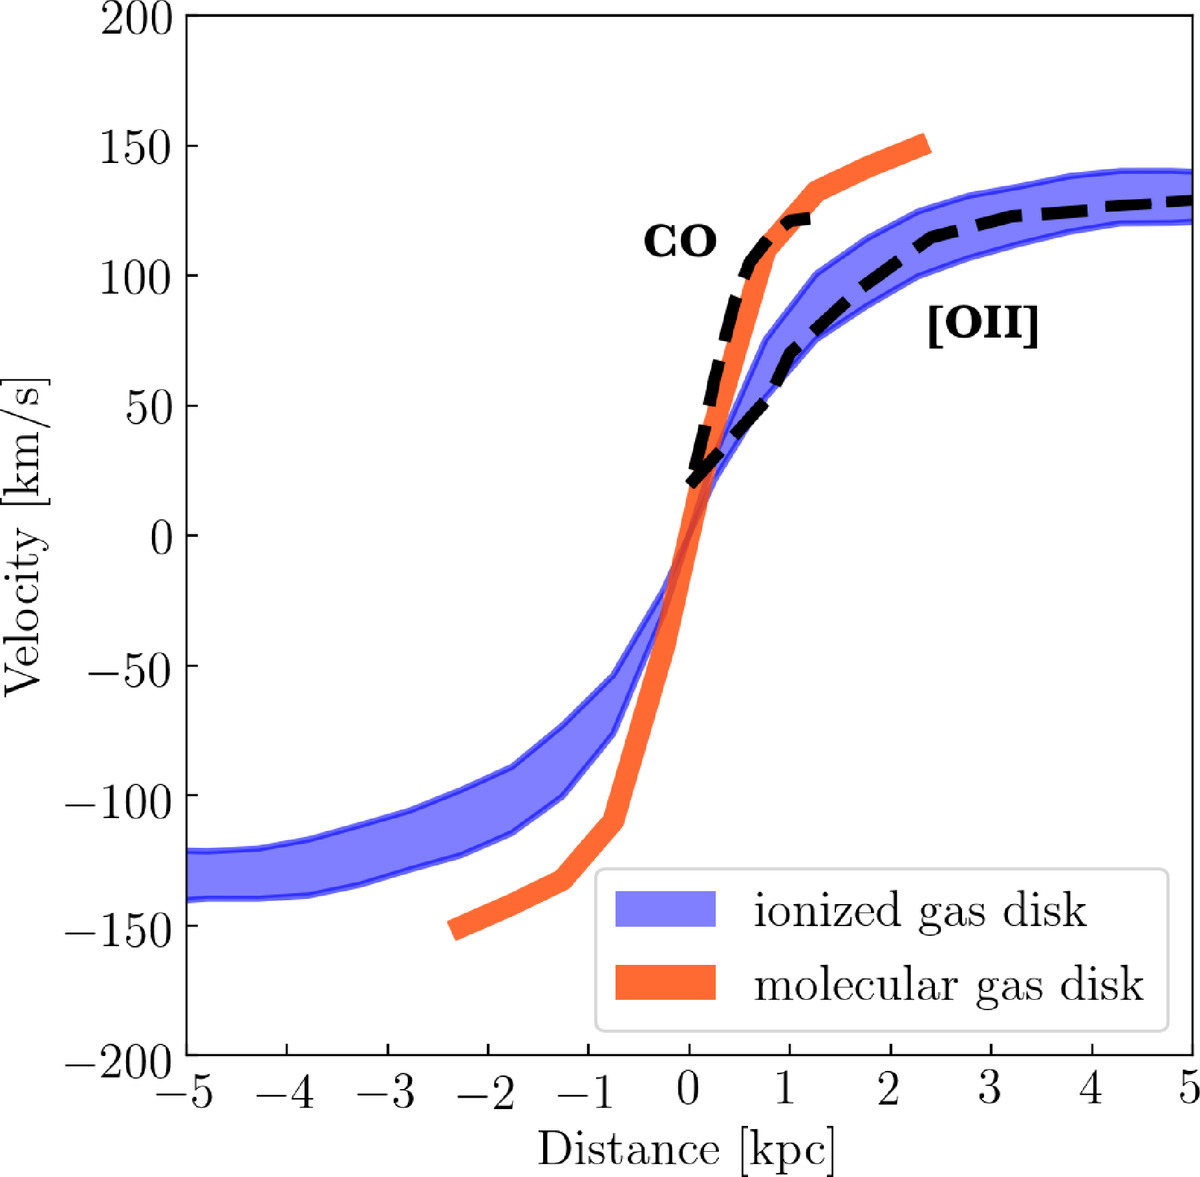
Rotation curves obtained in the simulated mass distribution corresponding to the parameters listed in Table 2, with two tracers: the molecular and ionized components. The results from the simulation for the molecular and ionized gas disks are shown in orange and in blue, respectively. The upper and lower boundaries of the ionized gas disk (taking the absolute values) represent a height of 1 kpc and 3 kpc, respectively. The dashed black lines indicate the observed CO and [O II] rotation curves of the Cosmic Snake.
Current usage metrics show cumulative count of Article Views (full-text article views including HTML views, PDF and ePub downloads, according to the available data) and Abstracts Views on Vision4Press platform.
Data correspond to usage on the plateform after 2015. The current usage metrics is available 48-96 hours after online publication and is updated daily on week days.
Initial download of the metrics may take a while.