Fig. 4.
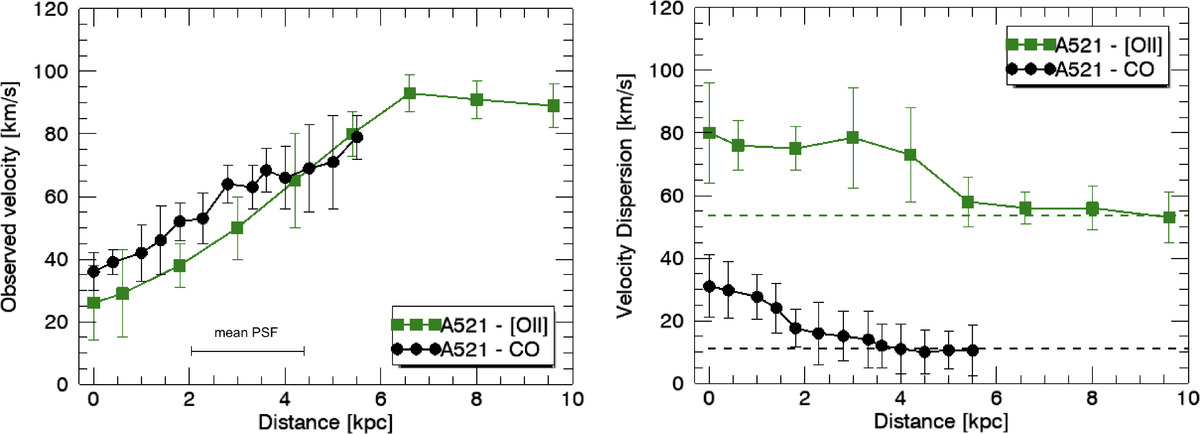
Observed velocity (left panel) and velocity dispersion profiles (right panel) of A521 from the [O II] emission line (in green) and CO(4-3) line (in black). The solid line is the average rotation curve of the two counter-images. The curves are extracted from the observed data in the image plane, uncorrected for beam-smearing or inclination. The data cubes for CO and [O II] were convolved to the same spatial resolution of 0.69″ (∼2 − 3 kpc on average). The two dashed lines indicate the intrinsic velocity dispersion of 54 ± 11 km s−1 and 11 ± 8 km s−1 measured from the [O II] (in green) and CO (in black) velocity dispersion maps at large radii (R > Re when possible), respectively.
Current usage metrics show cumulative count of Article Views (full-text article views including HTML views, PDF and ePub downloads, according to the available data) and Abstracts Views on Vision4Press platform.
Data correspond to usage on the plateform after 2015. The current usage metrics is available 48-96 hours after online publication and is updated daily on week days.
Initial download of the metrics may take a while.