Fig. 2.
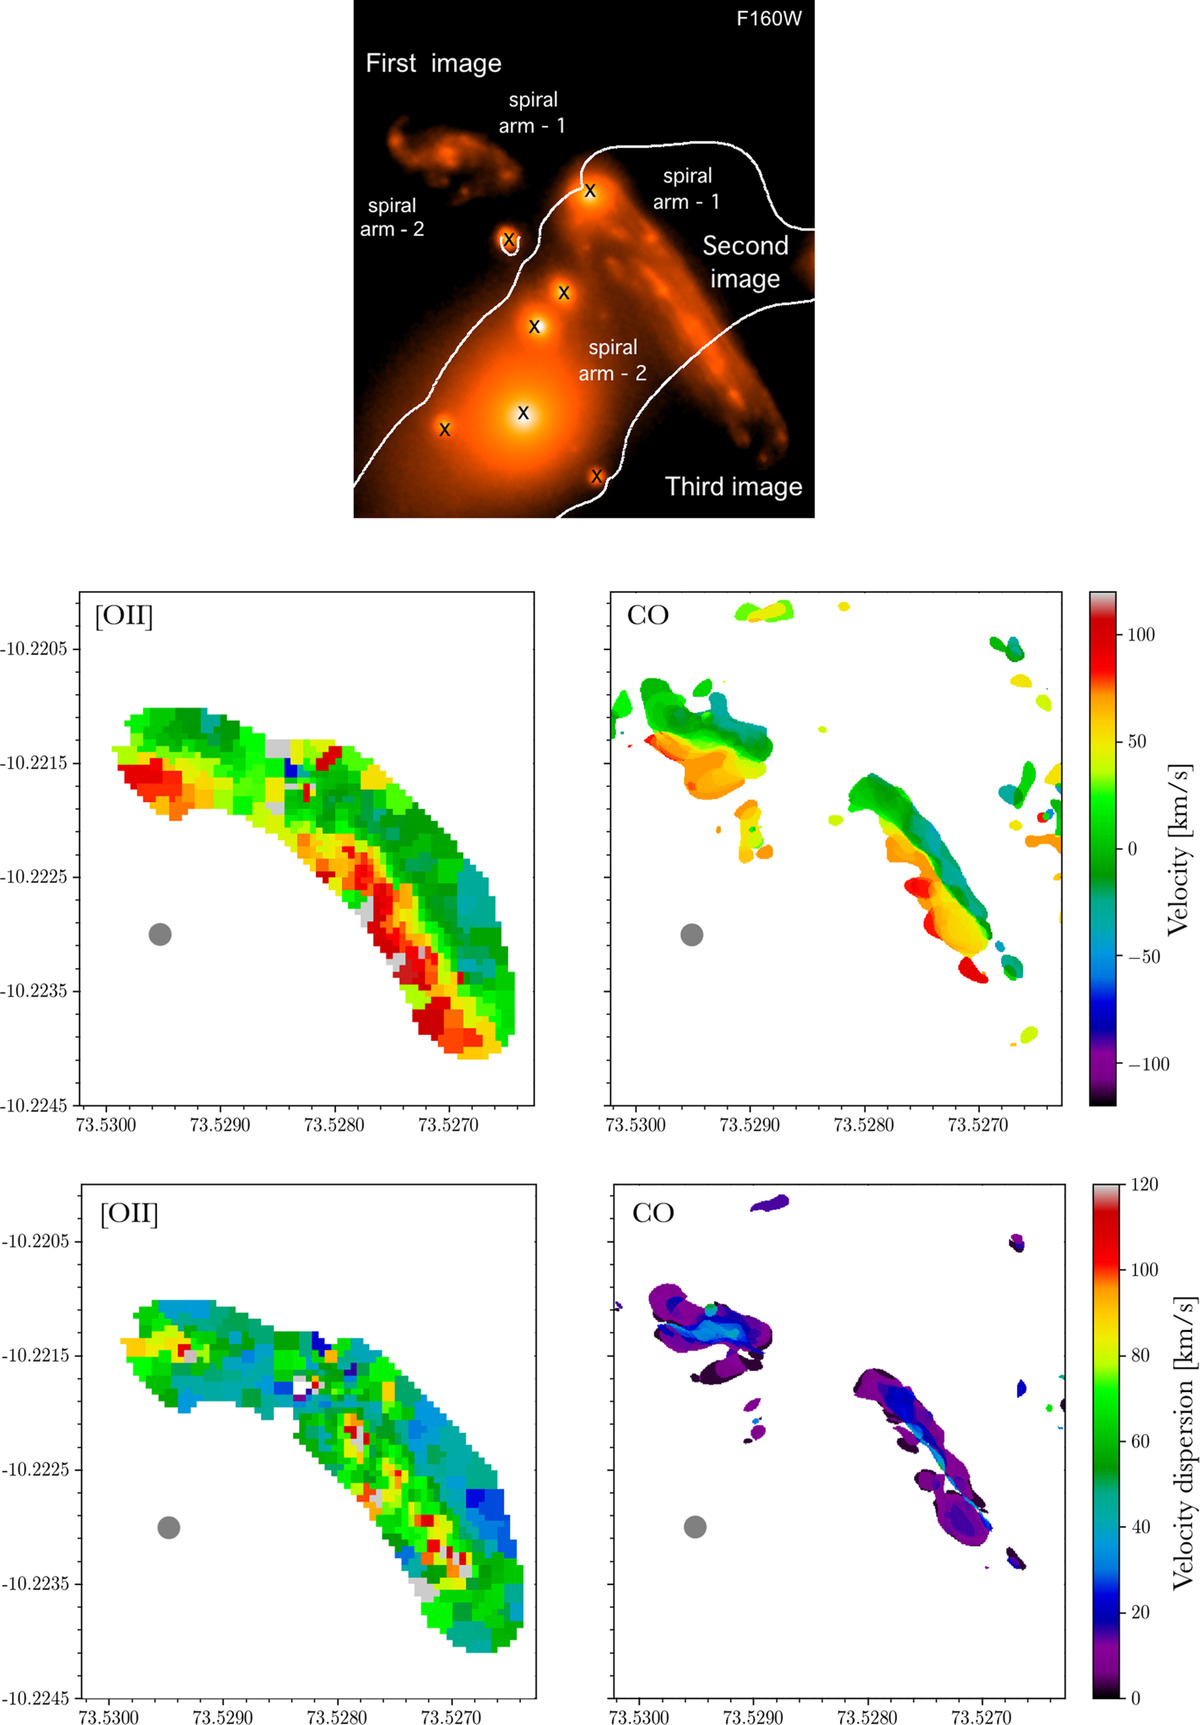
HST/WFC3 F160W near-infrared image (top panel), [O II] emission line velocity map (middle left), CO line velocity map (middle right), [O II] emission line velocity dispersion map (bottom left) and CO line velocity dispersion map (bottom right) of A521 in the image plane. The PSF of 0.69″ of the kinematic maps is shown as a gray circle in the bottom left corner. Both velocity dispersion maps are corrected for the instrumental broadening, but uncorrected for beam-smearing. The critical line from the lensing model is shown in white in the top panel. The HST image and kinematic maps are at the same scale.
Current usage metrics show cumulative count of Article Views (full-text article views including HTML views, PDF and ePub downloads, according to the available data) and Abstracts Views on Vision4Press platform.
Data correspond to usage on the plateform after 2015. The current usage metrics is available 48-96 hours after online publication and is updated daily on week days.
Initial download of the metrics may take a while.