Fig. 9.
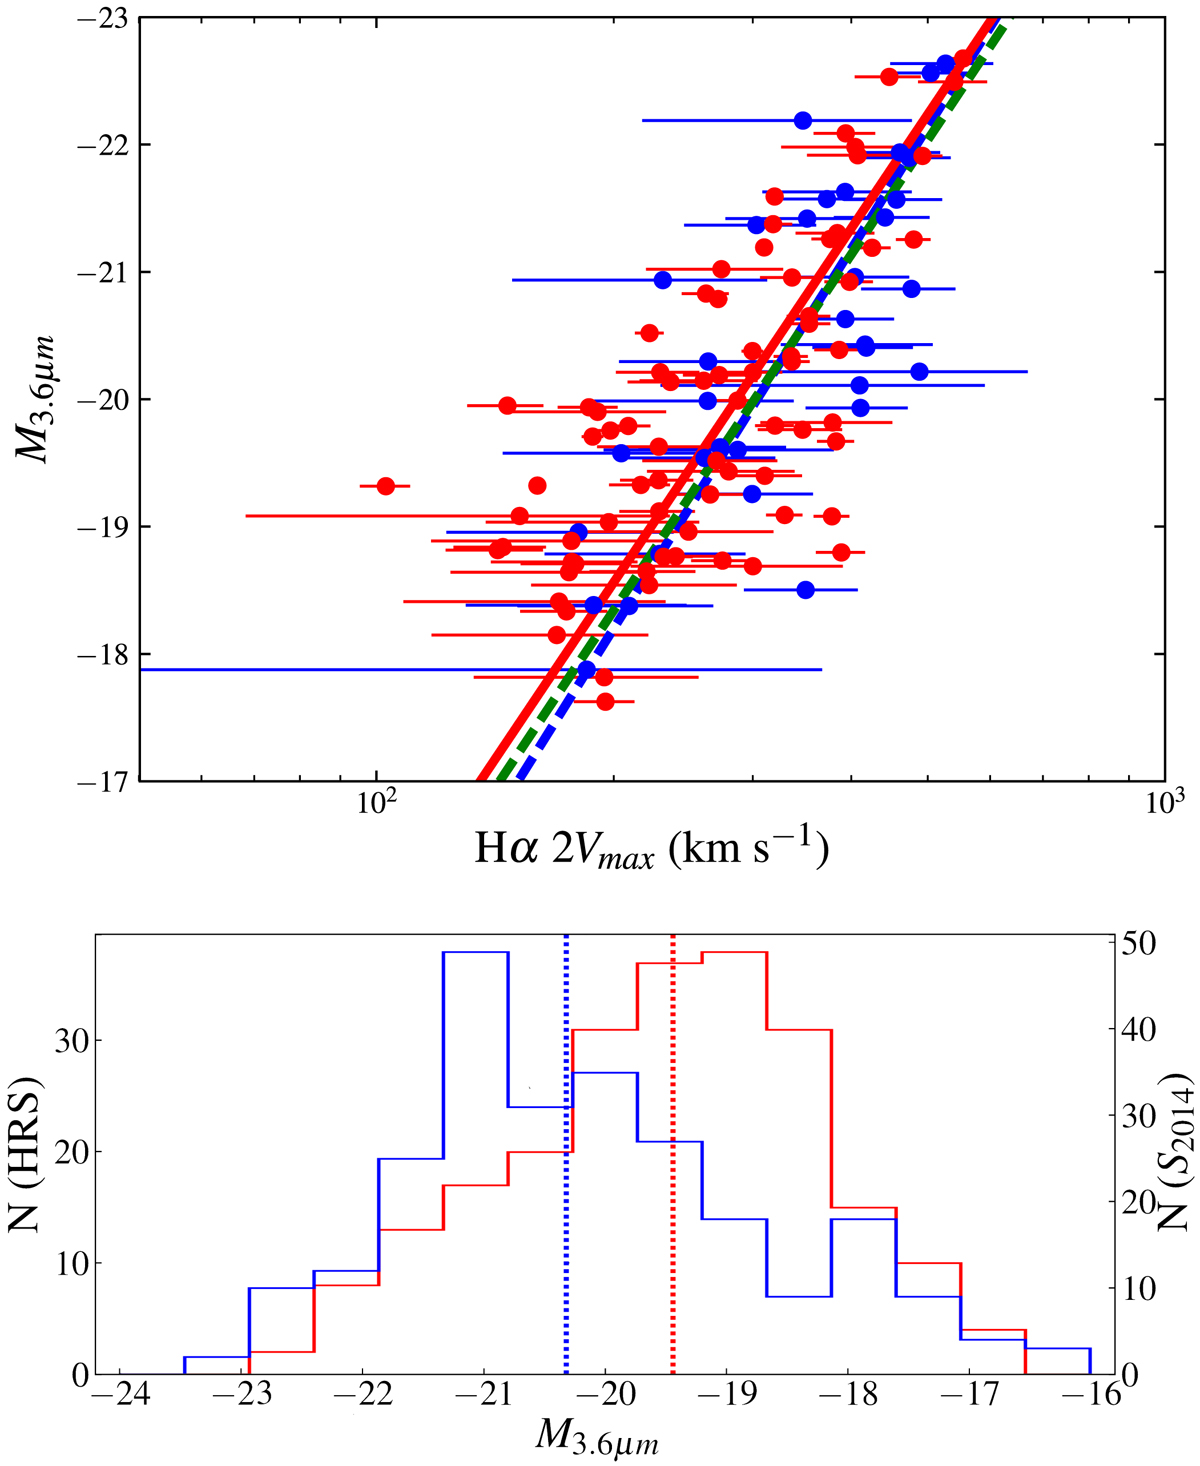
NIR S4G-3.6 μm band Tully-Fisher relation. The dashed blue line represents the Tully-Fisher relation determined by Sorce et al. (2014) for nearby galaxies, while the solid red line the OLS bisector regression to our data. Colors and symbols as in Fig. 8. Bottom panel: M3.6 μm distributions of the HRS (red) and the Sorce et al. (2014) sample (S2014, blue); dotted lines indicate the median value of the corresponding distribution (HRS is = −19.44, S2014 = −20.32).
Current usage metrics show cumulative count of Article Views (full-text article views including HTML views, PDF and ePub downloads, according to the available data) and Abstracts Views on Vision4Press platform.
Data correspond to usage on the plateform after 2015. The current usage metrics is available 48-96 hours after online publication and is updated daily on week days.
Initial download of the metrics may take a while.