Fig. 8
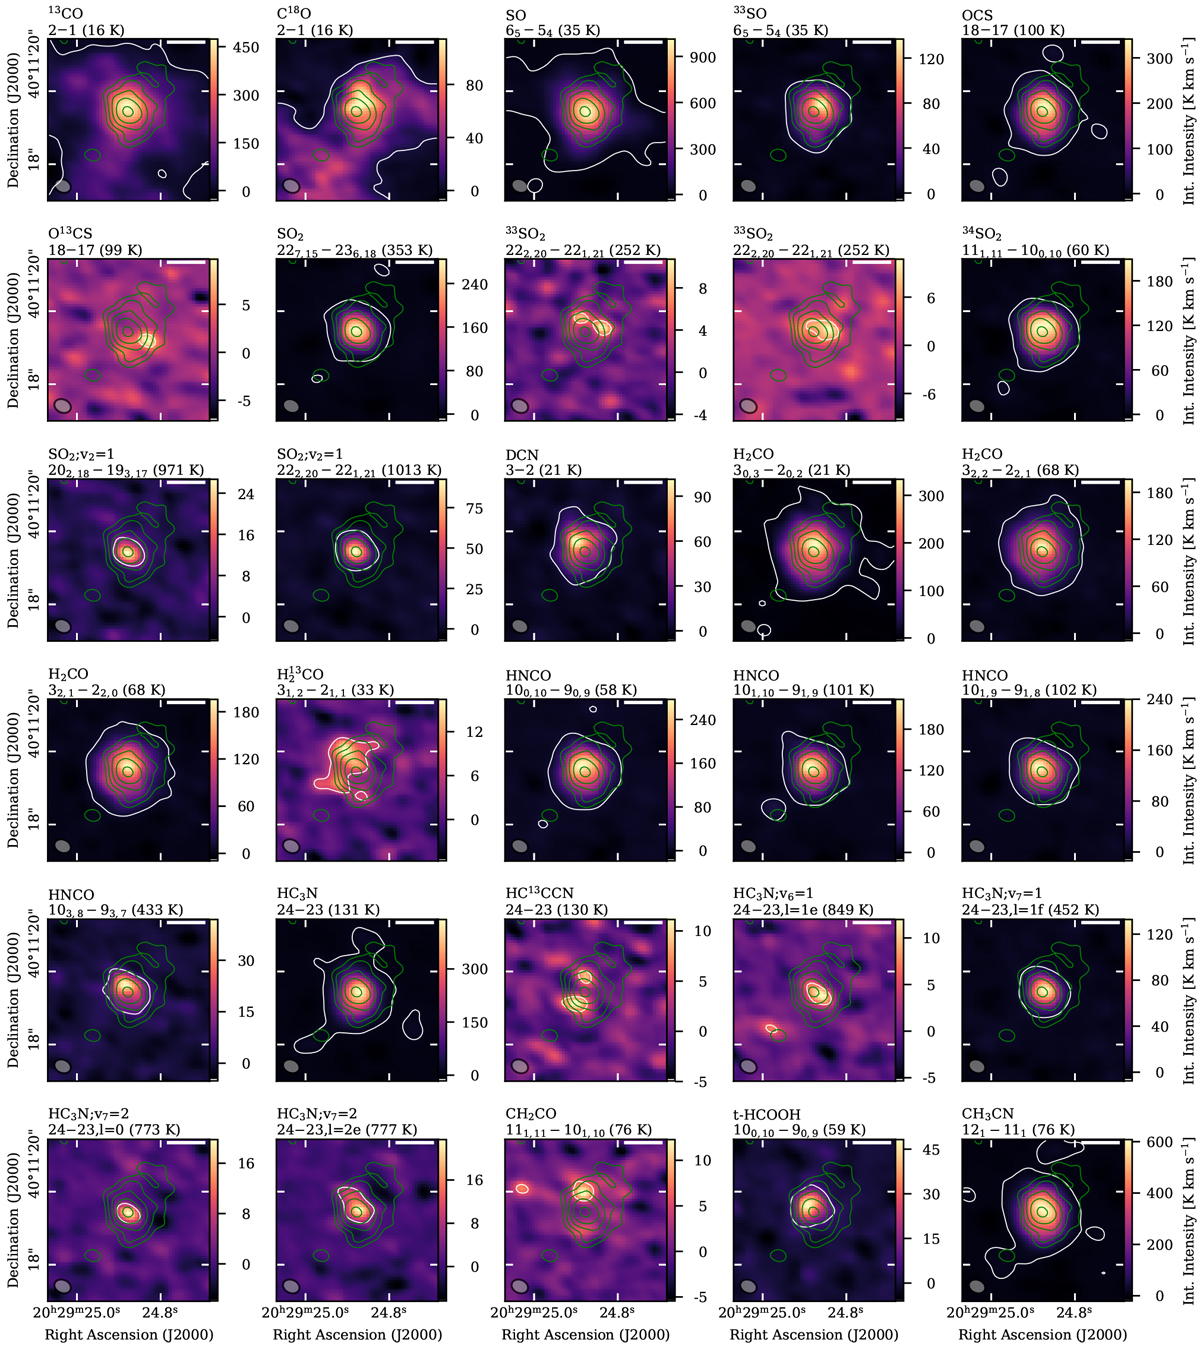
Integrated intensity maps of detected molecular emission lines. In each panel the molecule and transition are noted (see Table A.1). The color map shows the integrated intensity of the line emission. The white contours indicate the 5σ level of the integrated intensity (σ = 1.2 K km s−1). The green contours show the 1.37 mm continuum emission with levels at 5, 10, 20, 40, and 80σ (σ = 0.59 mJy beam−1). The beam size of the spectral line data (0″. 47 × 0″. 36) is shown in the lower left corner. The white bar in the top right corner indicates a spatial scale of 3330 au (1″).
Current usage metrics show cumulative count of Article Views (full-text article views including HTML views, PDF and ePub downloads, according to the available data) and Abstracts Views on Vision4Press platform.
Data correspond to usage on the plateform after 2015. The current usage metrics is available 48-96 hours after online publication and is updated daily on week days.
Initial download of the metrics may take a while.