Fig. 7
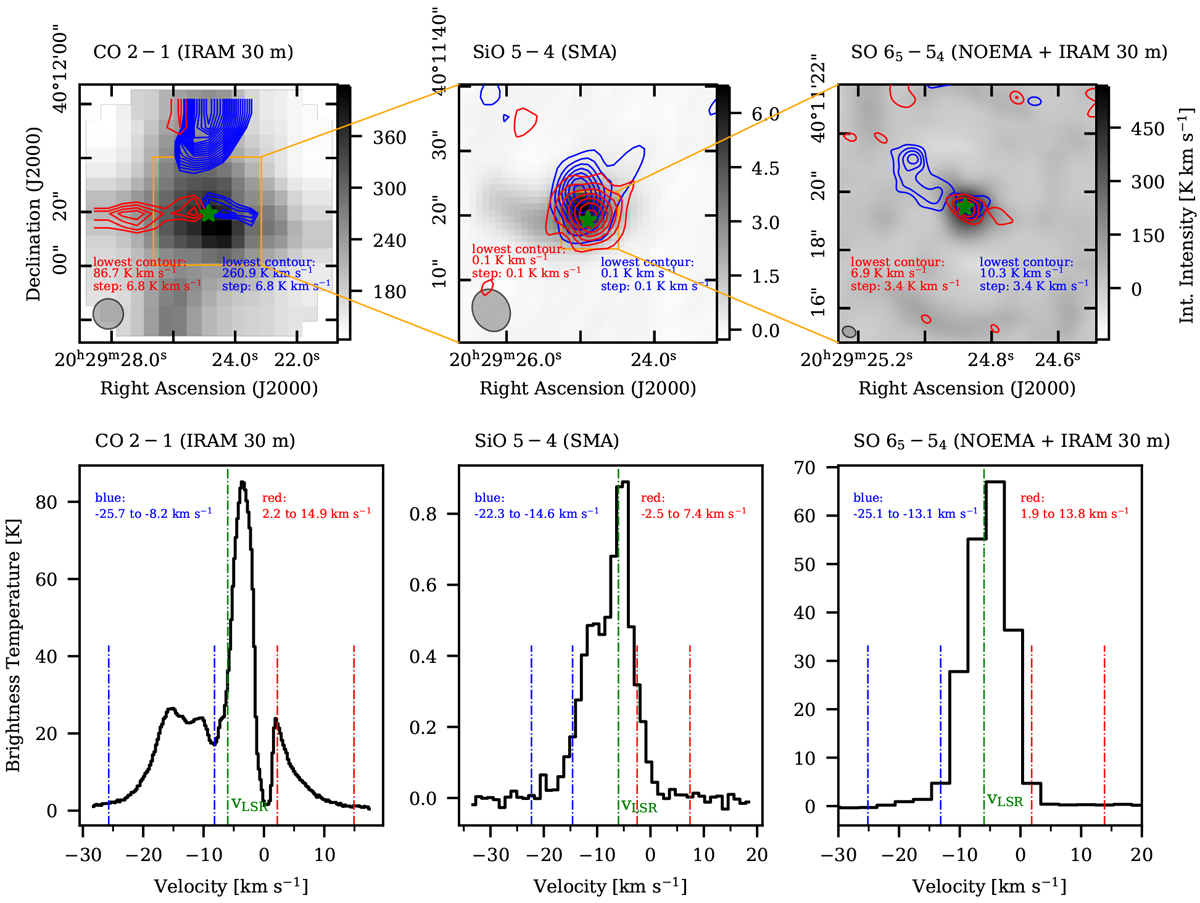
Outflow structure of AFGL 2591 at different spatial scales traced by IRAM 30 m observations of CO (left panels), SMA observations of SiO (central panels), and NOEMA + IRAM 30 m observations of SO (right panels). Upper panels: background gray scale shows the integrated intensity of the central line emission. The blue and red contours show the blue- and redshifted line emission. The beam size is given in the lower left corner in each panel. The green star marks the position of the 1.37 mm continuum peak. The orange box indicates the change of field of view. Lower panels: spectra of the outflow tracers extracted from the position of the 1.37 mm continuum peak (green star). The systemic velocity of −5.5 km s−1 is indicated by the green dashed line. The blue and red dashed lines show the integration intervals for the blue- and redshifted line emission. The integration interval of the central line emission is set between the two ranges.
Current usage metrics show cumulative count of Article Views (full-text article views including HTML views, PDF and ePub downloads, according to the available data) and Abstracts Views on Vision4Press platform.
Data correspond to usage on the plateform after 2015. The current usage metrics is available 48-96 hours after online publication and is updated daily on week days.
Initial download of the metrics may take a while.