Open Access
Fig. 6
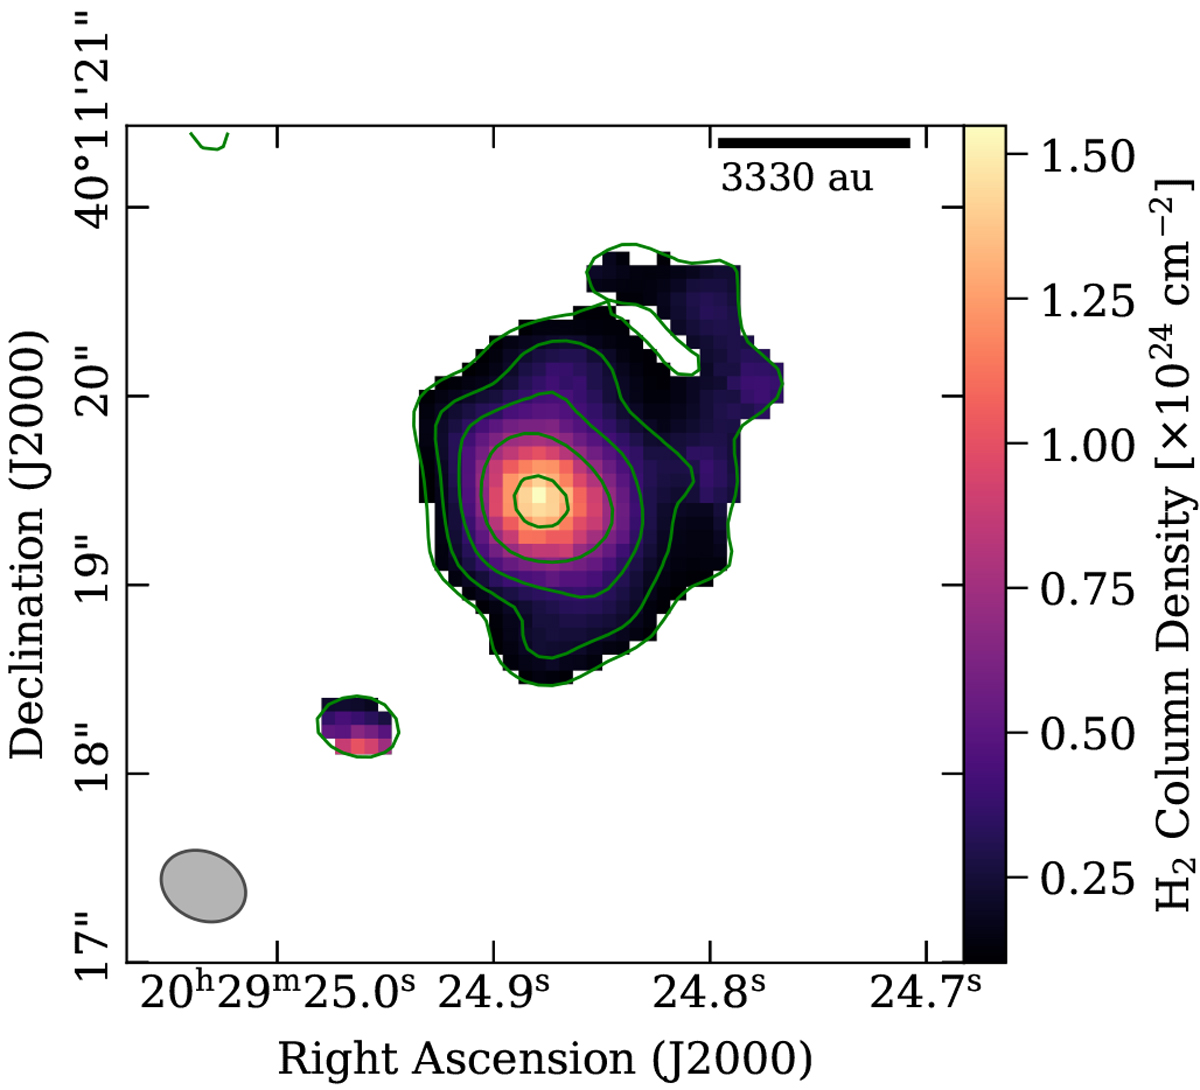
Column density distribution of H2 derived fromthe 1.37 mm continuum emission at a 5σ threshold. The green contours show the 1.37 mm continuum emission with levels at 5, 10, 20, 40, and 80σ (σ = 0.59 mJy beam−1). The beam size (0″. 46 × 0″. 36) is shown in the lower left corner.
Current usage metrics show cumulative count of Article Views (full-text article views including HTML views, PDF and ePub downloads, according to the available data) and Abstracts Views on Vision4Press platform.
Data correspond to usage on the plateform after 2015. The current usage metrics is available 48-96 hours after online publication and is updated daily on week days.
Initial download of the metrics may take a while.