Fig. 4
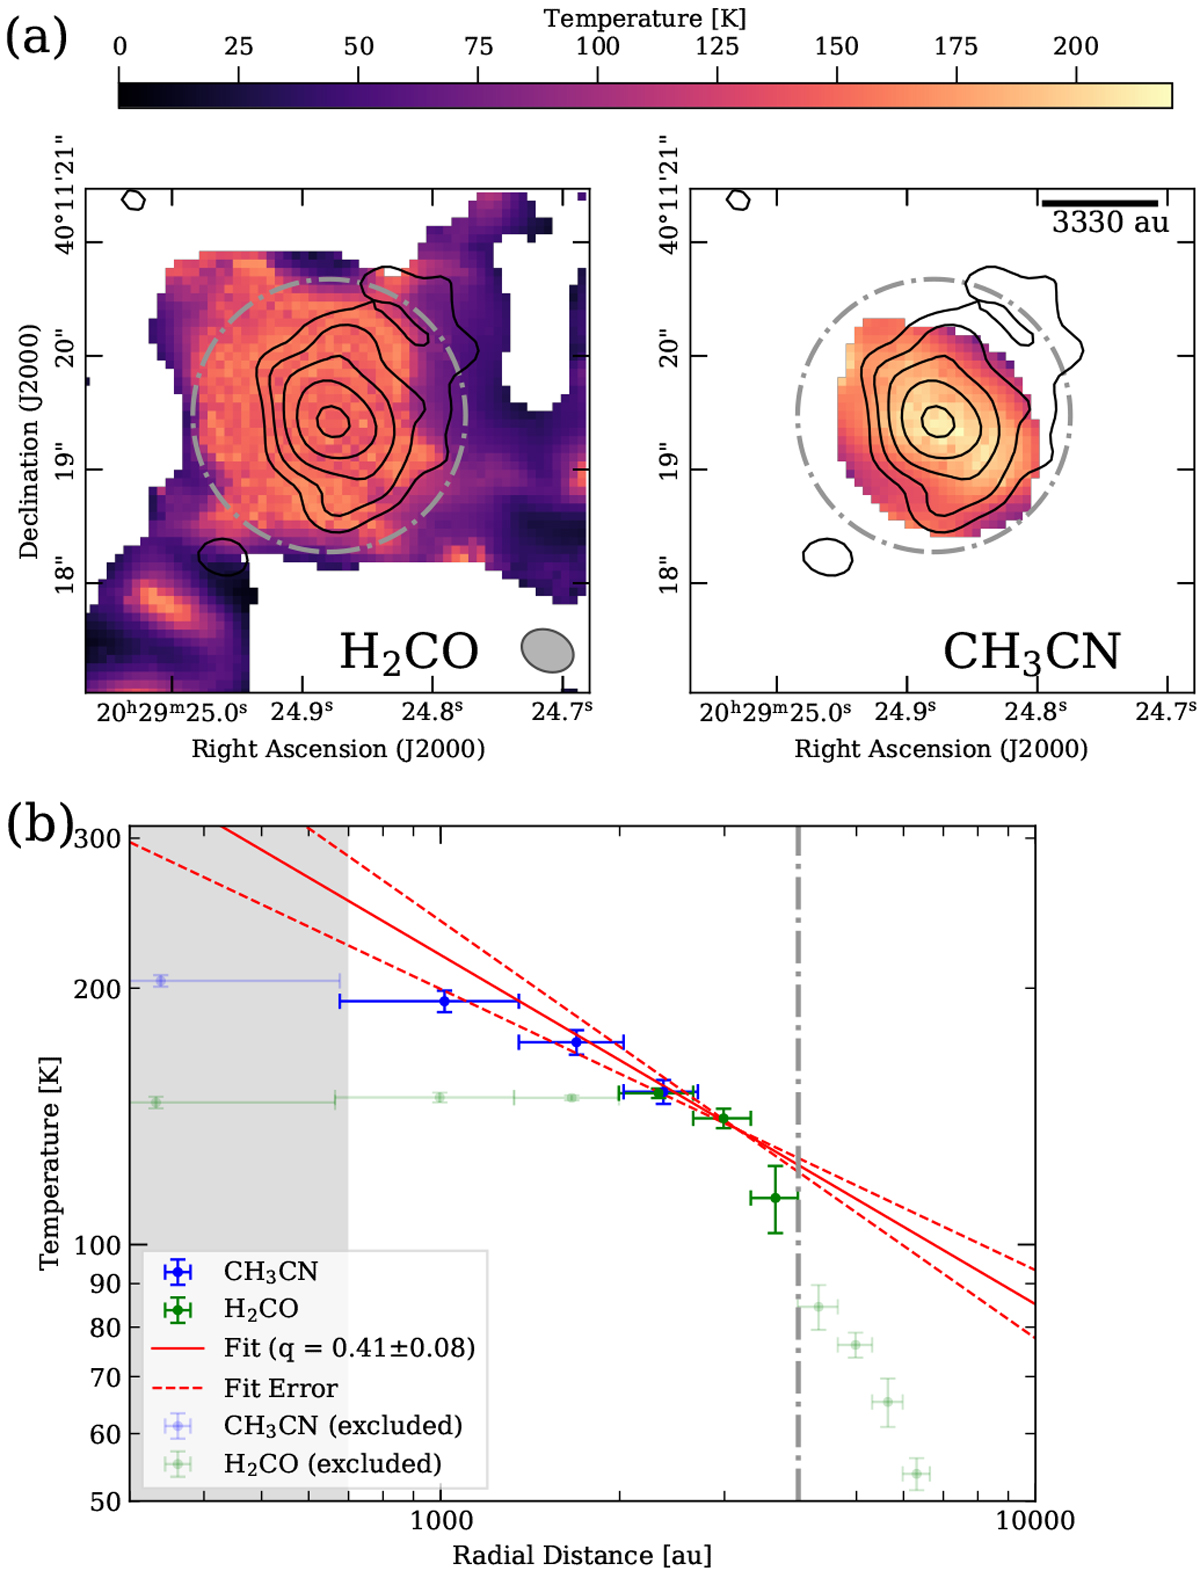
Panel a: H2CO and CH3CN temperature maps derived with XCLASS at a threshold of 10σ. The black contours show the 1.37 mm continuum emission with levels at 5, 10, 20, 40, and 80σ (σ = 0.59 mJy beam−1). The gray dash-dotted circle indicates the outer radius of the radial temperature fit (bottom panel). The beam size (0″. 47 × 0″. 36) is shown in the lower right corner of the H2CO temperaturemap. Panel b: radial temperature profiles obtained from the data in the top panel. The data are binned in steps of half a beam size (~700 au) for H2 CO (green data points) and CH3CN (blue data points). A power-law fit was performed on spatial scales in the range 700− 4000 au to determinethe temperature power-law index q. The gray dash-dotted line indicates the outer radius of the radial temperature fit. At radii smaller than 700 au the temperatureprofile cannot be determined due to the finite beam size (gray shaded area). The transparent data points were excluded from the fitting. The best fit is shown by the red solid line. The error of the fit (one standard deviation) is shown by the red dashed lines.
Current usage metrics show cumulative count of Article Views (full-text article views including HTML views, PDF and ePub downloads, according to the available data) and Abstracts Views on Vision4Press platform.
Data correspond to usage on the plateform after 2015. The current usage metrics is available 48-96 hours after online publication and is updated daily on week days.
Initial download of the metrics may take a while.