Fig. 3
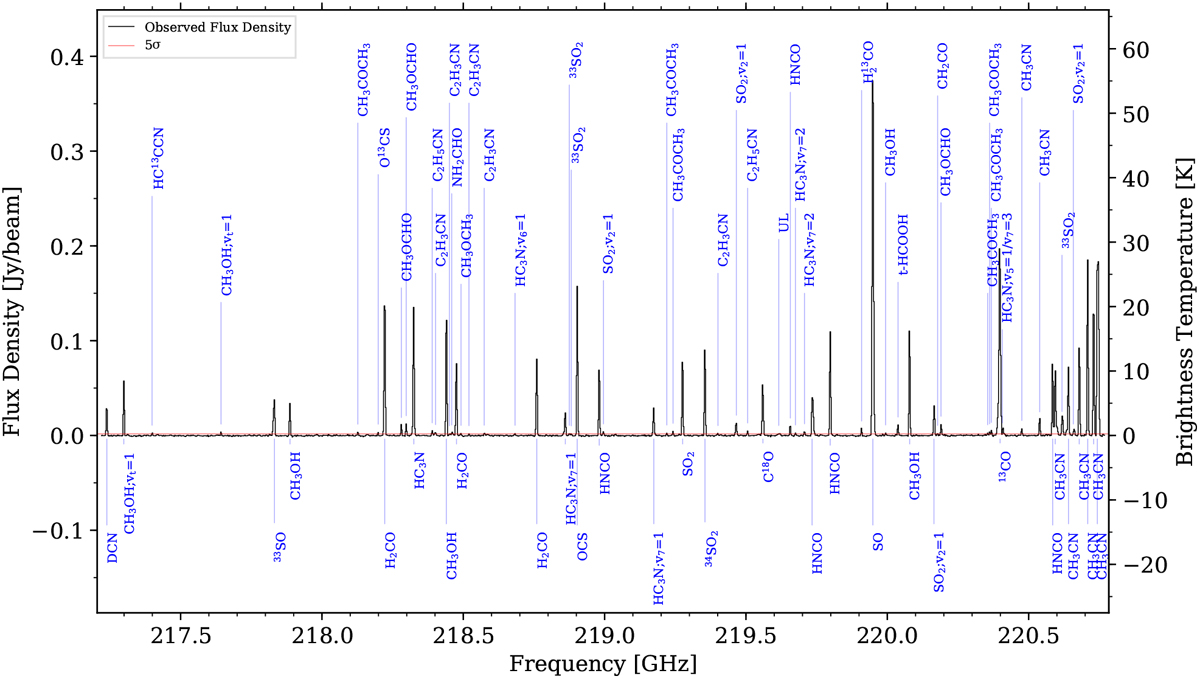
Average spectrum (spatially averaged over 1″. 6 × 1″. 6, indicated by the white rectangle in Fig. 2) of the AFGL 2591 hot core labeled with molecular emission lines with S∕N > 5 (indicated by the red horizontal line, σ = 0.34 mJy beam−1 in the average spectrum). Unidentified lines are labeled UL. A detailed table of the properties of the molecular transitions is given in Appendix A.
Current usage metrics show cumulative count of Article Views (full-text article views including HTML views, PDF and ePub downloads, according to the available data) and Abstracts Views on Vision4Press platform.
Data correspond to usage on the plateform after 2015. The current usage metrics is available 48-96 hours after online publication and is updated daily on week days.
Initial download of the metrics may take a while.