Fig. 2
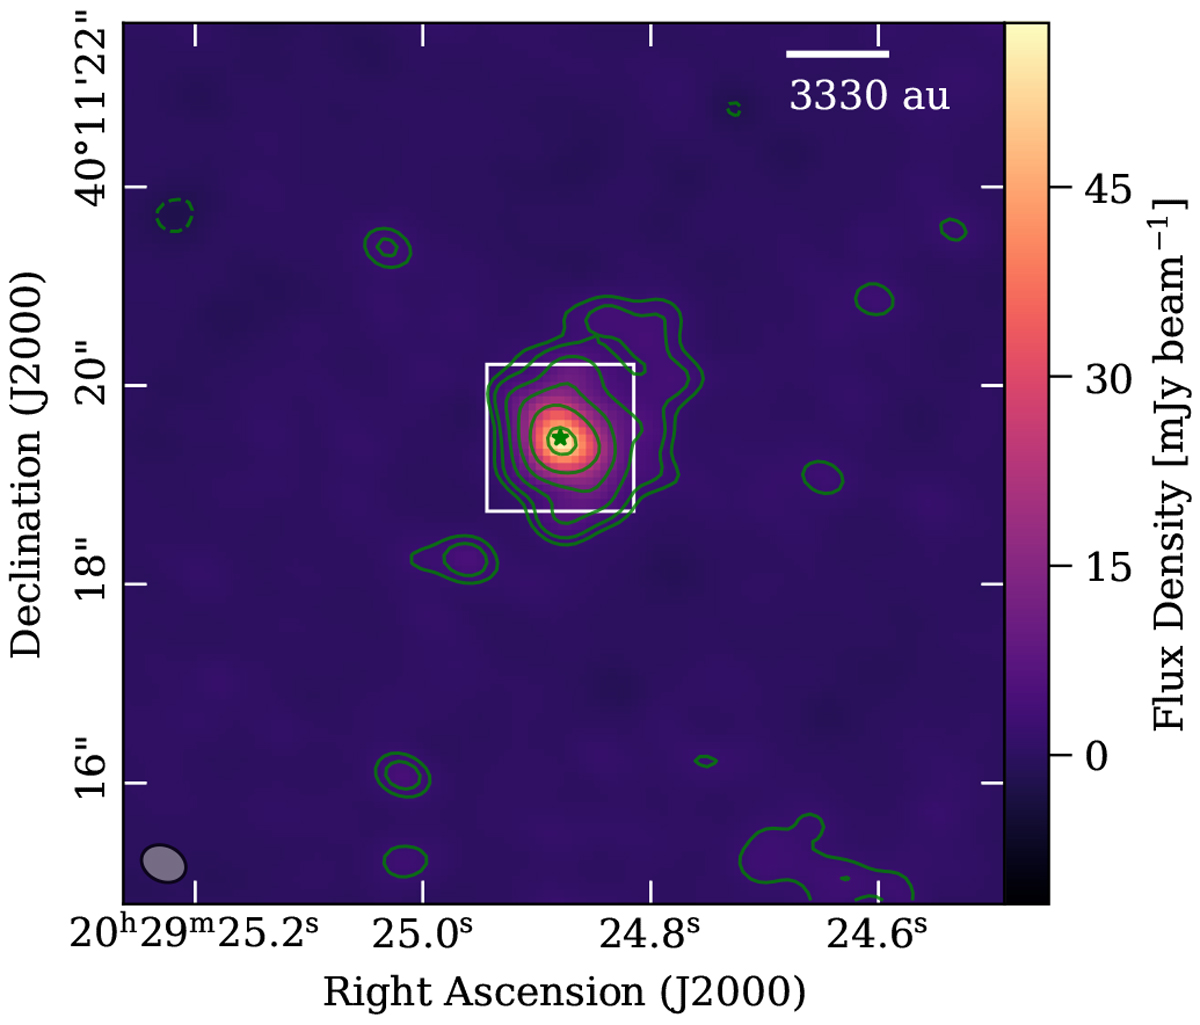
AFGL2591 continuum emission at 1.37 mm. The green contours show the 1.37 mm continuum emission with levels at −3 (dashed), 3, 5, 10, 20, 40, and 80σ (σ = 0.59 mJy beam−1). The beam size (0″. 46 × 0″. 36) is shown inthe lower left corner. The green star indicates the position of the 1.37 mm continuum peak. The white rectangle shows the region within which an average spectrum was obtained in the spectral line data for line identification (Sect. 3.2).
Current usage metrics show cumulative count of Article Views (full-text article views including HTML views, PDF and ePub downloads, according to the available data) and Abstracts Views on Vision4Press platform.
Data correspond to usage on the plateform after 2015. The current usage metrics is available 48-96 hours after online publication and is updated daily on week days.
Initial download of the metrics may take a while.