Open Access
Fig. B.1
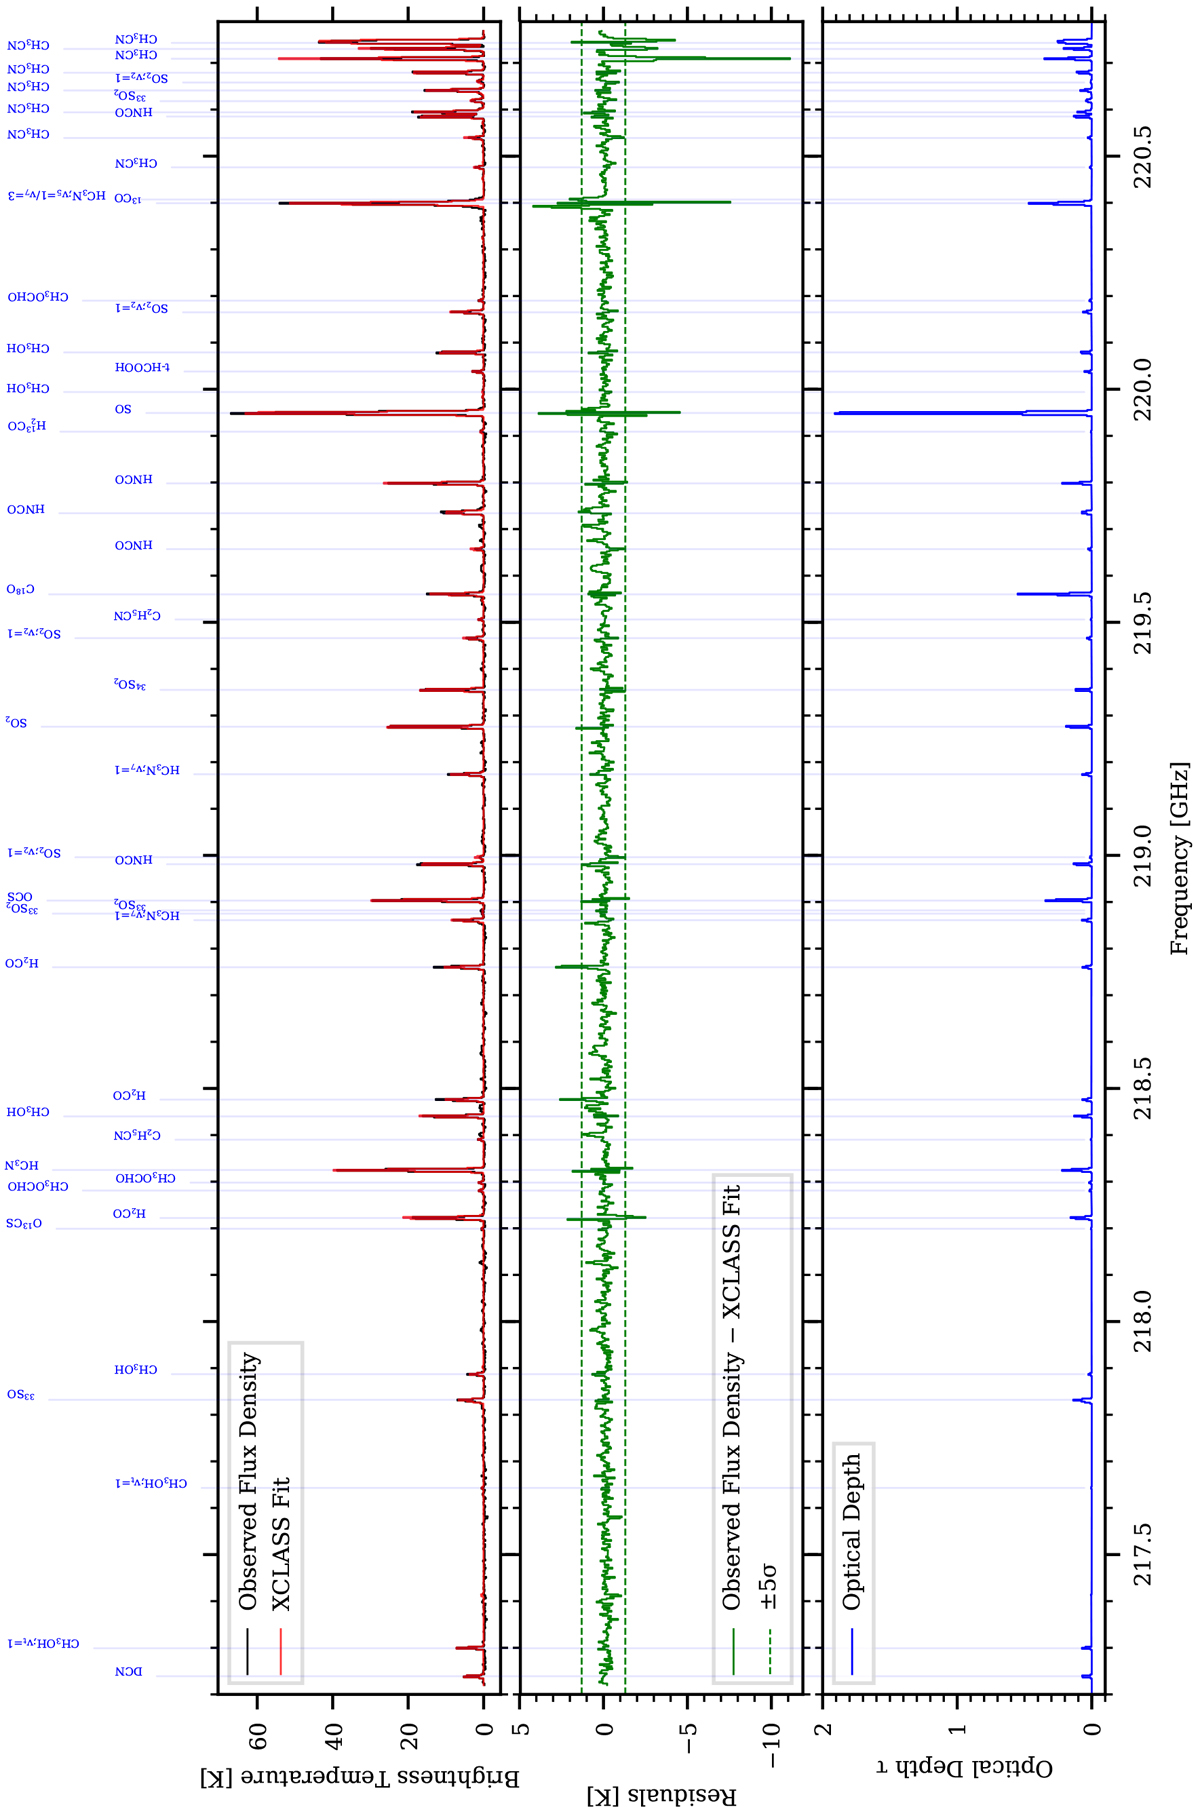
Comparison of the observed and fitted XCLASS spectrum. Upper panel: AFGL 2591 spectrum towards the continuum peak (black line) and the total XCLASS fit spectrum (red line). Middle panel: residuals (green line). Bottom panel: optical depth τ (blue line) of the transitions computed with XCLASS.
Current usage metrics show cumulative count of Article Views (full-text article views including HTML views, PDF and ePub downloads, according to the available data) and Abstracts Views on Vision4Press platform.
Data correspond to usage on the plateform after 2015. The current usage metrics is available 48-96 hours after online publication and is updated daily on week days.
Initial download of the metrics may take a while.