Fig. 1
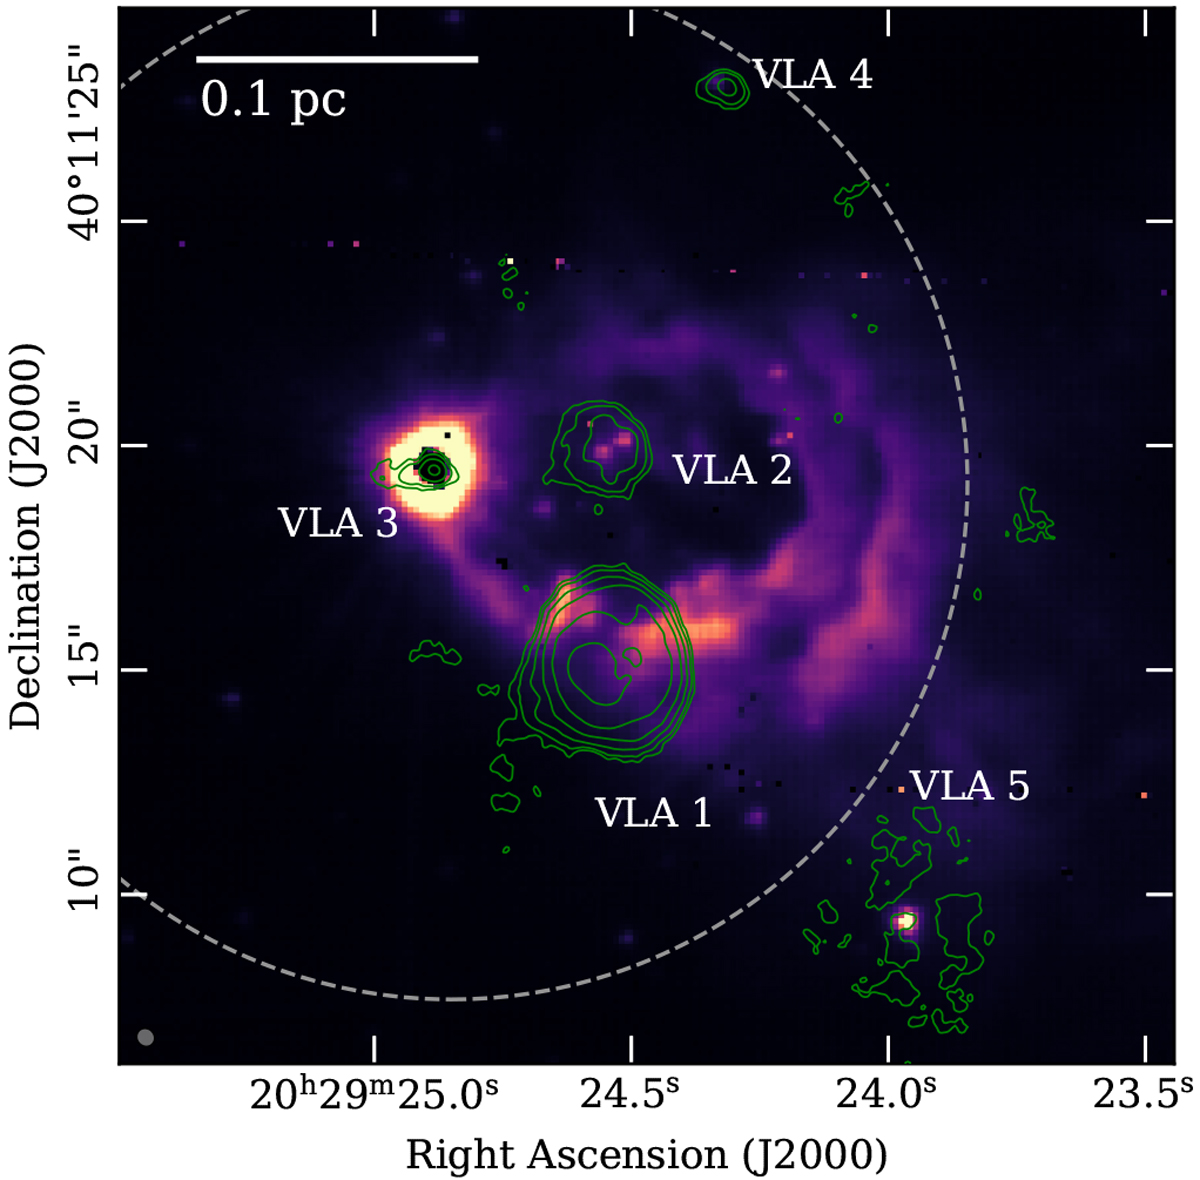
Overview of the AFGL 2591 star-forming region. The background color map shows an infrared image obtained with Gemini in the K′ band. The green contours show the 3.6 cm radio continuum emission taken from Johnston et al. (2013). The contours are drawn at levels of 3, 5, 10, 20, 40, 80, and 160σ (σ = 0.03 mJy beam−1). The VLA beam size (0″. 43 × 0″. 40) is shown inthe lower left corner. The gray dashed circle indicates the primary beam of our NOEMA observations (23″).
Current usage metrics show cumulative count of Article Views (full-text article views including HTML views, PDF and ePub downloads, according to the available data) and Abstracts Views on Vision4Press platform.
Data correspond to usage on the plateform after 2015. The current usage metrics is available 48-96 hours after online publication and is updated daily on week days.
Initial download of the metrics may take a while.