Fig. 6
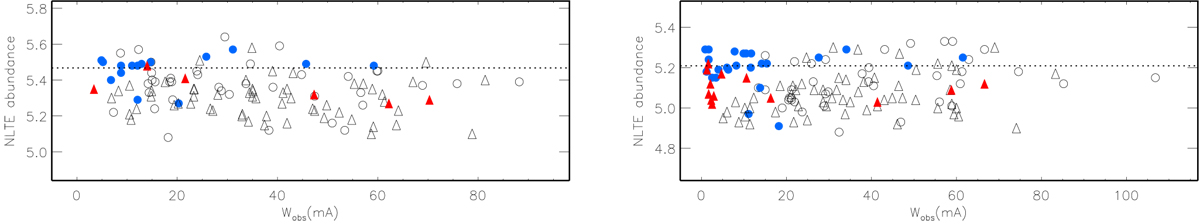
NLTE abundances of HD 84937 (left panel) and HD 140283 (right panel) from lines of Fe I (circles) and Fe II (triangles) in the YBK18+YBK19 scenario as a function of observed equivalent width Wobs. The filled and open symbols correspond to the visible and UV lines, respectively. In each panel, the dotted line indicates the mean abundance derived from the Fe I visible lines.
Current usage metrics show cumulative count of Article Views (full-text article views including HTML views, PDF and ePub downloads, according to the available data) and Abstracts Views on Vision4Press platform.
Data correspond to usage on the plateform after 2015. The current usage metrics is available 48-96 hours after online publication and is updated daily on week days.
Initial download of the metrics may take a while.