Fig. 4
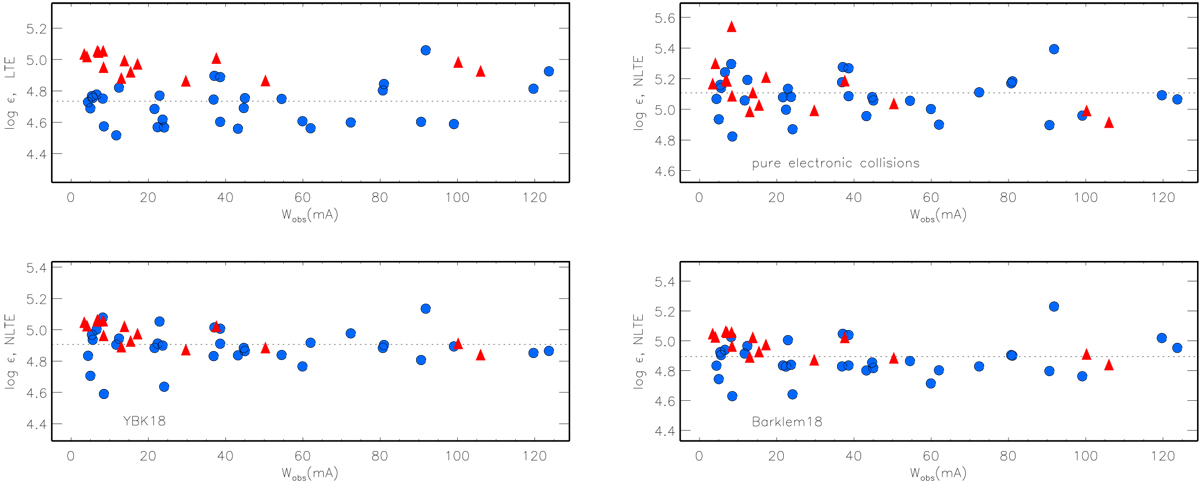
LTE (top left panel) and NLTE (other three panels) abundances from lines of Fe I (circles) and Fe II (triangles) in HD 122563 as a function of observed equivalent width Wobs. Top right panel: NLTE calculations with pure electronic collisions. Bottom row, left and right panels: YBK18+YBK19 and B18+YBK19 scenarios, respectively. In each panel, the dotted line indicates the mean abundance derived from the Fe I lines.
Current usage metrics show cumulative count of Article Views (full-text article views including HTML views, PDF and ePub downloads, according to the available data) and Abstracts Views on Vision4Press platform.
Data correspond to usage on the plateform after 2015. The current usage metrics is available 48-96 hours after online publication and is updated daily on week days.
Initial download of the metrics may take a while.