Fig. 13.
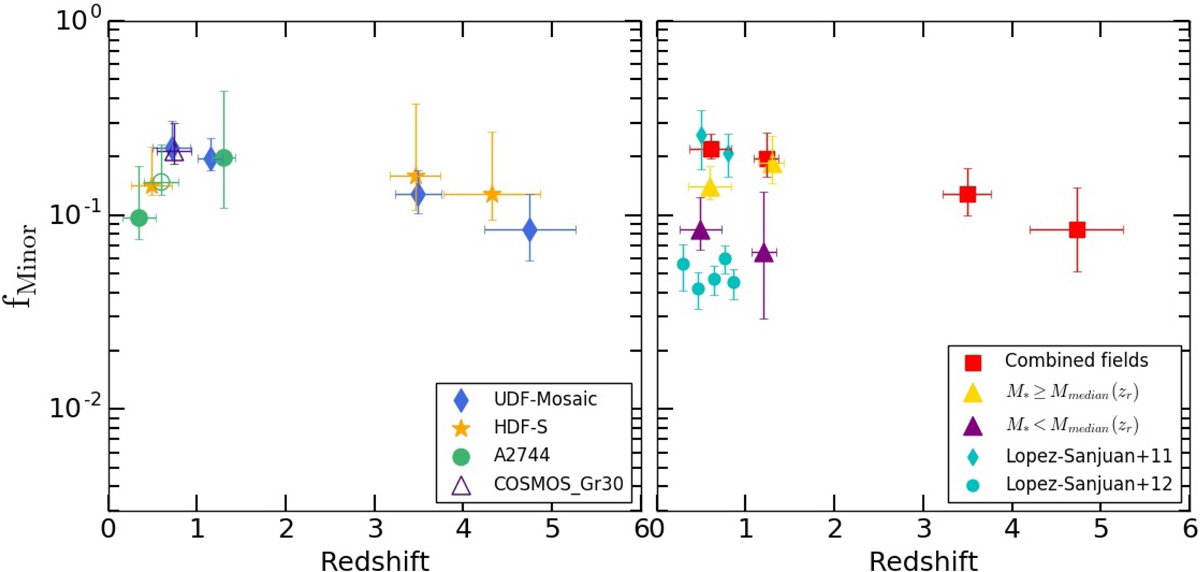
Evolution of the galaxy minor merger fraction up to z ∼ 6 from MUSE deep fields, for primary galaxies with a stellar mass range of ∼ 109 − 1011 M⊙. Left: as in Fig. 11; different symbols show the results from the four regions individually. Right: red squares are estimates of the combined minor merger fraction from the whole MUSE data set and over the whole stellar mass range ∼ 109 − 1011 M⊙. Using the median value of stellar mass in each redshift bin as a separation limit (∼ 1010 M⊙, see Table 2), the purple and golden triangles correspond to the minor merger fraction for low-mass and massive galaxies, respectively. As in Fig. 11, filled and open symbols correspond to the fractions computed without and with galaxy members of the cluster and group for 0.2 ≤ z ≤ 1, respectively. Cyan points are estimates from previous spectroscopic minor pair counts (López-Sanjuan et al. 2011, 2012).
Current usage metrics show cumulative count of Article Views (full-text article views including HTML views, PDF and ePub downloads, according to the available data) and Abstracts Views on Vision4Press platform.
Data correspond to usage on the plateform after 2015. The current usage metrics is available 48-96 hours after online publication and is updated daily on week days.
Initial download of the metrics may take a while.