Free Access
Fig. 3.
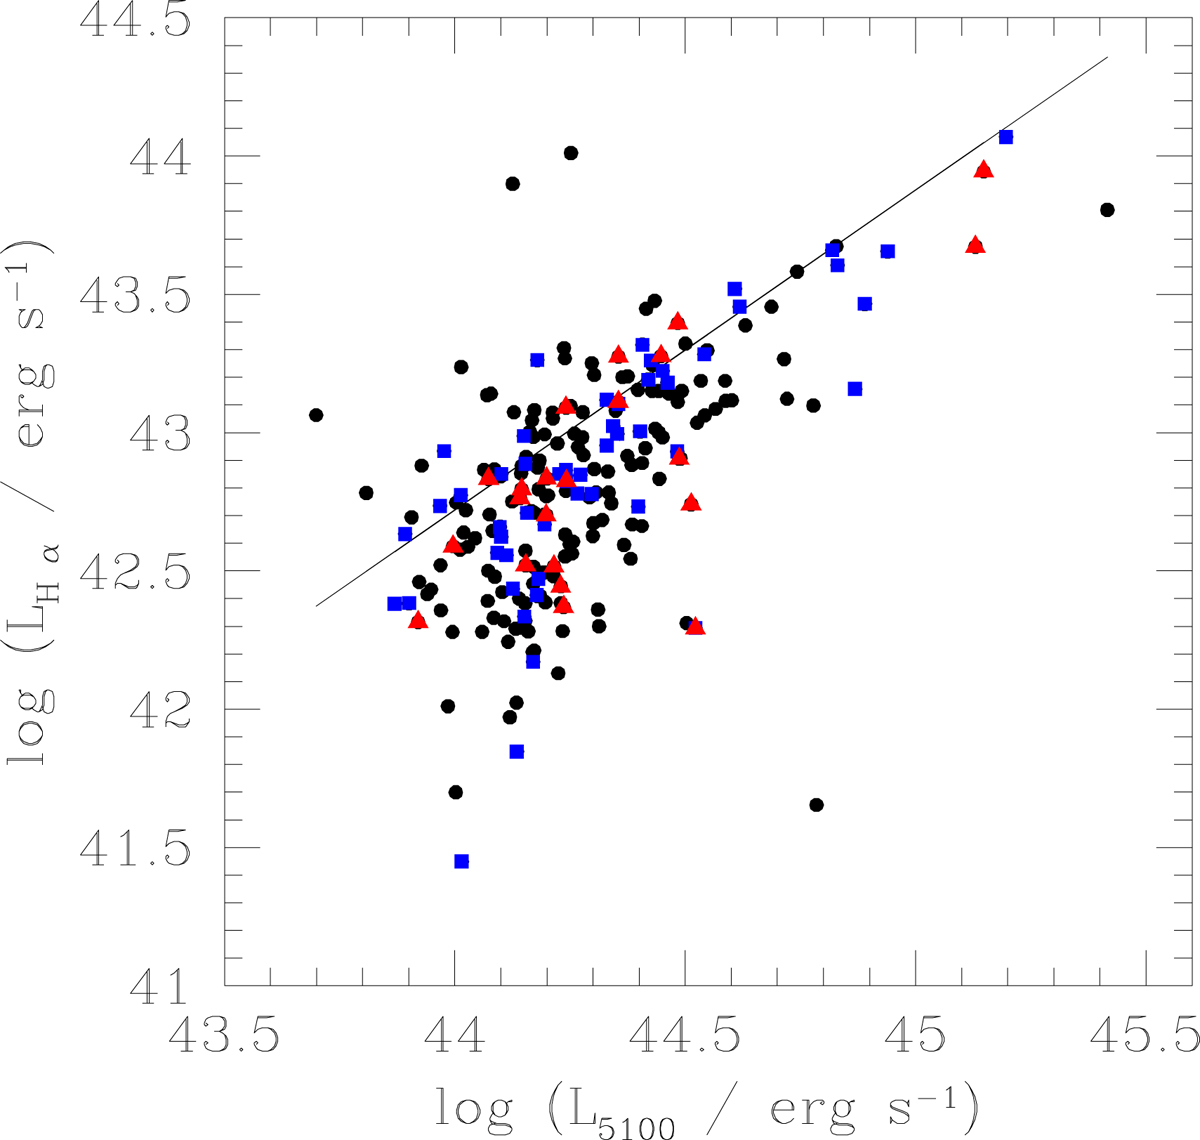
Correlation between LHα and L5100 of the radio-loud sample. The solid line represents the relation of LHα–L5100 given by Greene & Ho (2005) derived for radio-quiet AGNs. Unclassified radio-loud quasars, FSRQs, and SSRQs from our AGN sample are represented by black, red, and blue symbols, respectively.
Current usage metrics show cumulative count of Article Views (full-text article views including HTML views, PDF and ePub downloads, according to the available data) and Abstracts Views on Vision4Press platform.
Data correspond to usage on the plateform after 2015. The current usage metrics is available 48-96 hours after online publication and is updated daily on week days.
Initial download of the metrics may take a while.