Fig. 2.
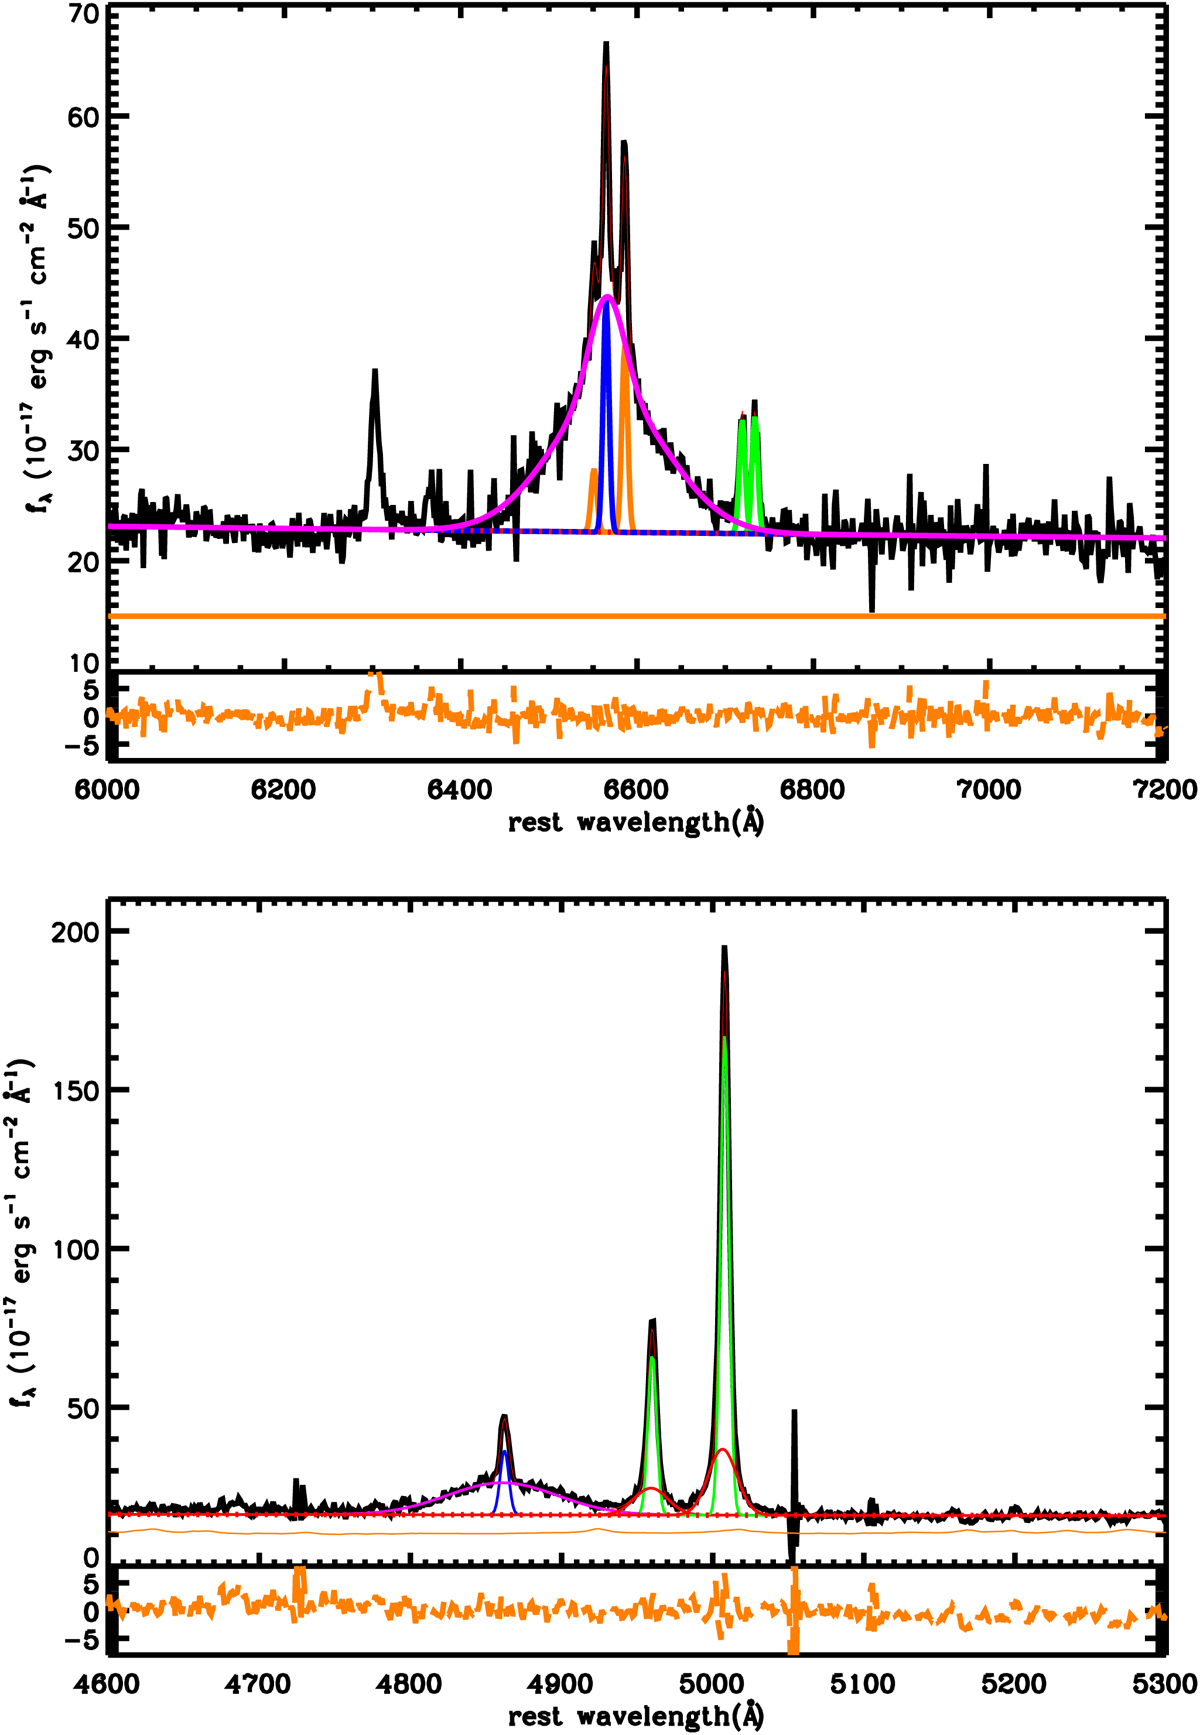
Examples of fits to the spectra in Hα (upper panel) and Hβ regions (lower panel), respectively. Black lines in both panels indicate the observed spectrum, and thick red lines indicate the complete fit to the spectra including all the Gaussian components. The power-law continuum and the Fe II template are shown by red and orange lines, respectively. Broad and narrow Hα are shown in the upper panel by magenta and blue lines, respectively. The [S II] and [N II] lines are shown by green and orange lines, respectively. Broad and narrow Hβ are shown in the lower panel by magenta and blue lines, respectively. The narrow core of [O III] is shown by a green line, and the wing component is represented by a red line. The fit residuals are shown in the lower panels of both panels.
Current usage metrics show cumulative count of Article Views (full-text article views including HTML views, PDF and ePub downloads, according to the available data) and Abstracts Views on Vision4Press platform.
Data correspond to usage on the plateform after 2015. The current usage metrics is available 48-96 hours after online publication and is updated daily on week days.
Initial download of the metrics may take a while.