Fig. 8.
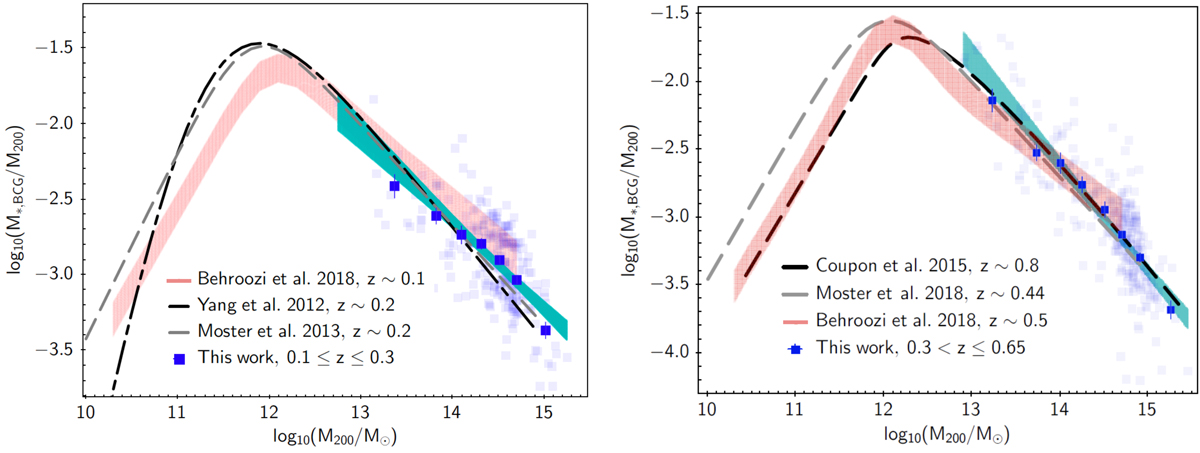
Stellar-to-halo mass ratio vs. host halo mass of BCGs. The shaded blue areas and the blue squares show the 95% confidence level of the fitted model and the mean of the stellar-to-halo mass ratio of BCGs at a given halo mass, respectively. Their error bars represent the standard error in stellar mass fraction including intrinsic and measurement uncertainties. The red shaded area is the same relation from Behroozi et al. (2010) at z ∼ 0.1 and z ∼ 0.5, respectively. The dash-dotted black line in the left panel shows the Yang et al. (2009) relation at z ∼ 0.1. The gray dashed lines show the Moster et al. (2018) relation.
Current usage metrics show cumulative count of Article Views (full-text article views including HTML views, PDF and ePub downloads, according to the available data) and Abstracts Views on Vision4Press platform.
Data correspond to usage on the plateform after 2015. The current usage metrics is available 48-96 hours after online publication and is updated daily on week days.
Initial download of the metrics may take a while.