Fig. 5.
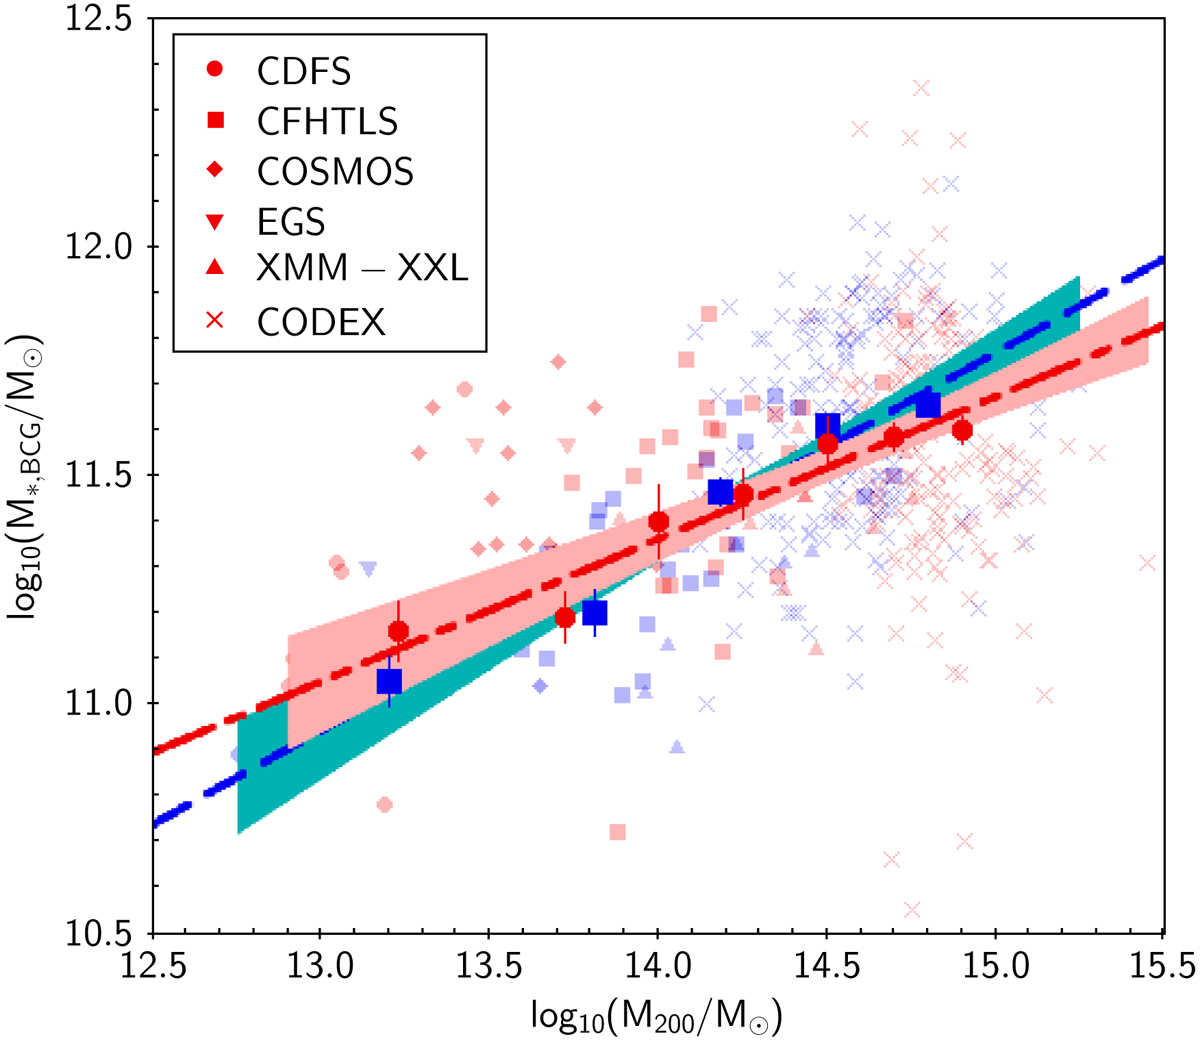
Stellar masses vs. halo masses of the BCGs in our sample. Different symbols represent different surveys. The blue shaded symbols show BCGs with 0.1 ≤ z ≤ 0.3 and the red shaded symbols show BCGs with 0.3 < z ≤ 0.65. The blue dashed and the red dash-dotted lines show the best power-law fits for the low and high redshifts, respectively. The blue and red shaded area around the fitted lines represent 95% confidence levels of the fits. The blue squares and red dots with error bars present the mean of stellar mass of BCGs at a given halo mass. The error bars are their standard errors. The Pearson correlation coefficient is 0.7 for low redshift BCGs and 0.4 for high redshift BCGs.
Current usage metrics show cumulative count of Article Views (full-text article views including HTML views, PDF and ePub downloads, according to the available data) and Abstracts Views on Vision4Press platform.
Data correspond to usage on the plateform after 2015. The current usage metrics is available 48-96 hours after online publication and is updated daily on week days.
Initial download of the metrics may take a while.