Fig. 2.
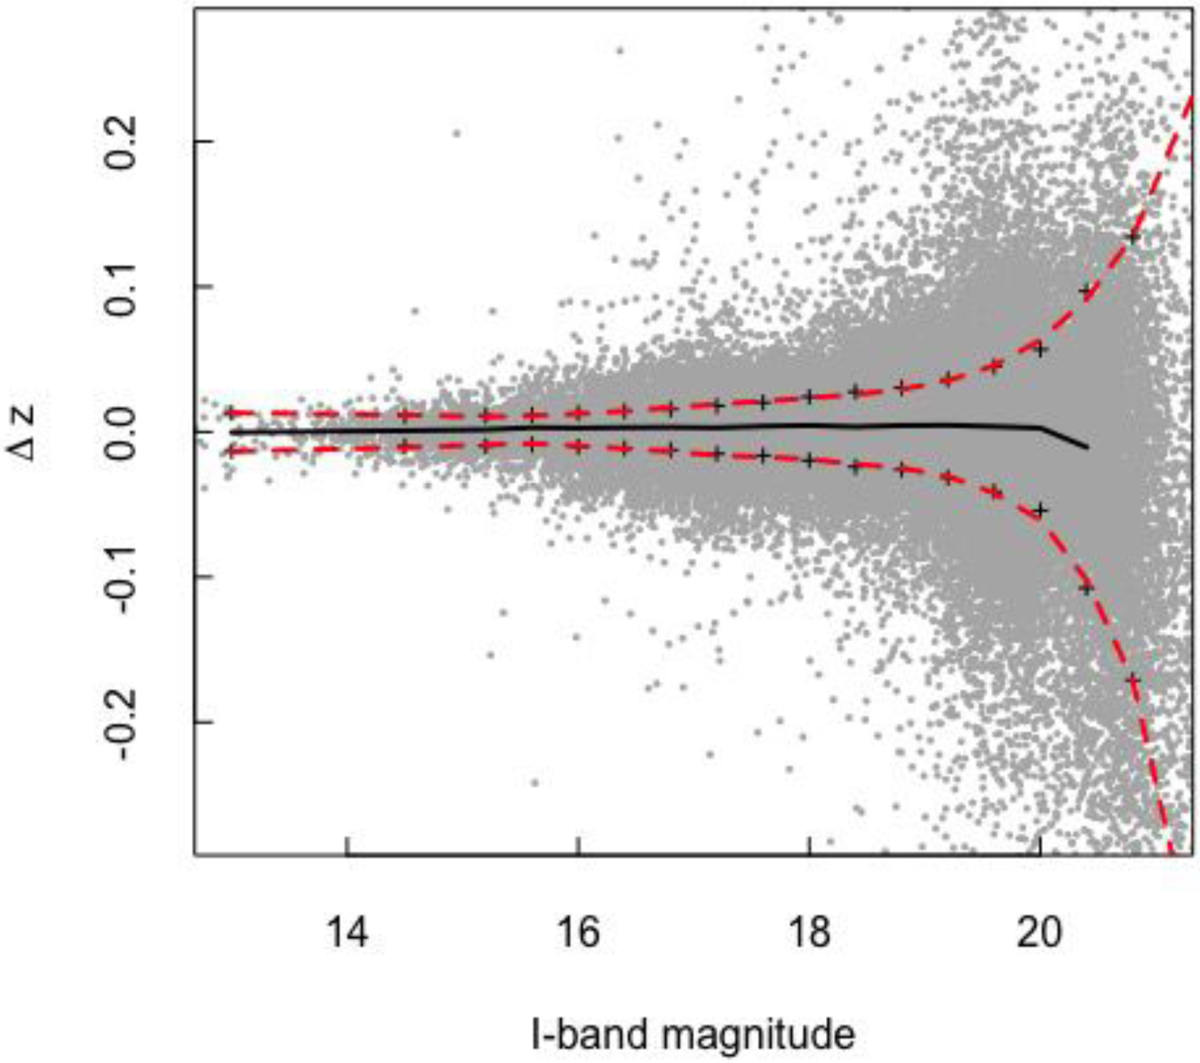
Relation (Photometric redshifts–Spectroscopic redshifts)/(1 + Spectroscopic redshifts) (Δz) vs. i-band cModel magnitude for a sample of galaxies with both spectroscopic and photometric redshifts in SDSS DR14 (gray dots). The black pluses and black solid line show the dispersion and peak of the Gaussian fitted in each i-band magnitude bin, respectively. There are in total 17 bins. The red dashed lines indicate the model fitted to the dispersions.
Current usage metrics show cumulative count of Article Views (full-text article views including HTML views, PDF and ePub downloads, according to the available data) and Abstracts Views on Vision4Press platform.
Data correspond to usage on the plateform after 2015. The current usage metrics is available 48-96 hours after online publication and is updated daily on week days.
Initial download of the metrics may take a while.