Open Access
Fig. 7.
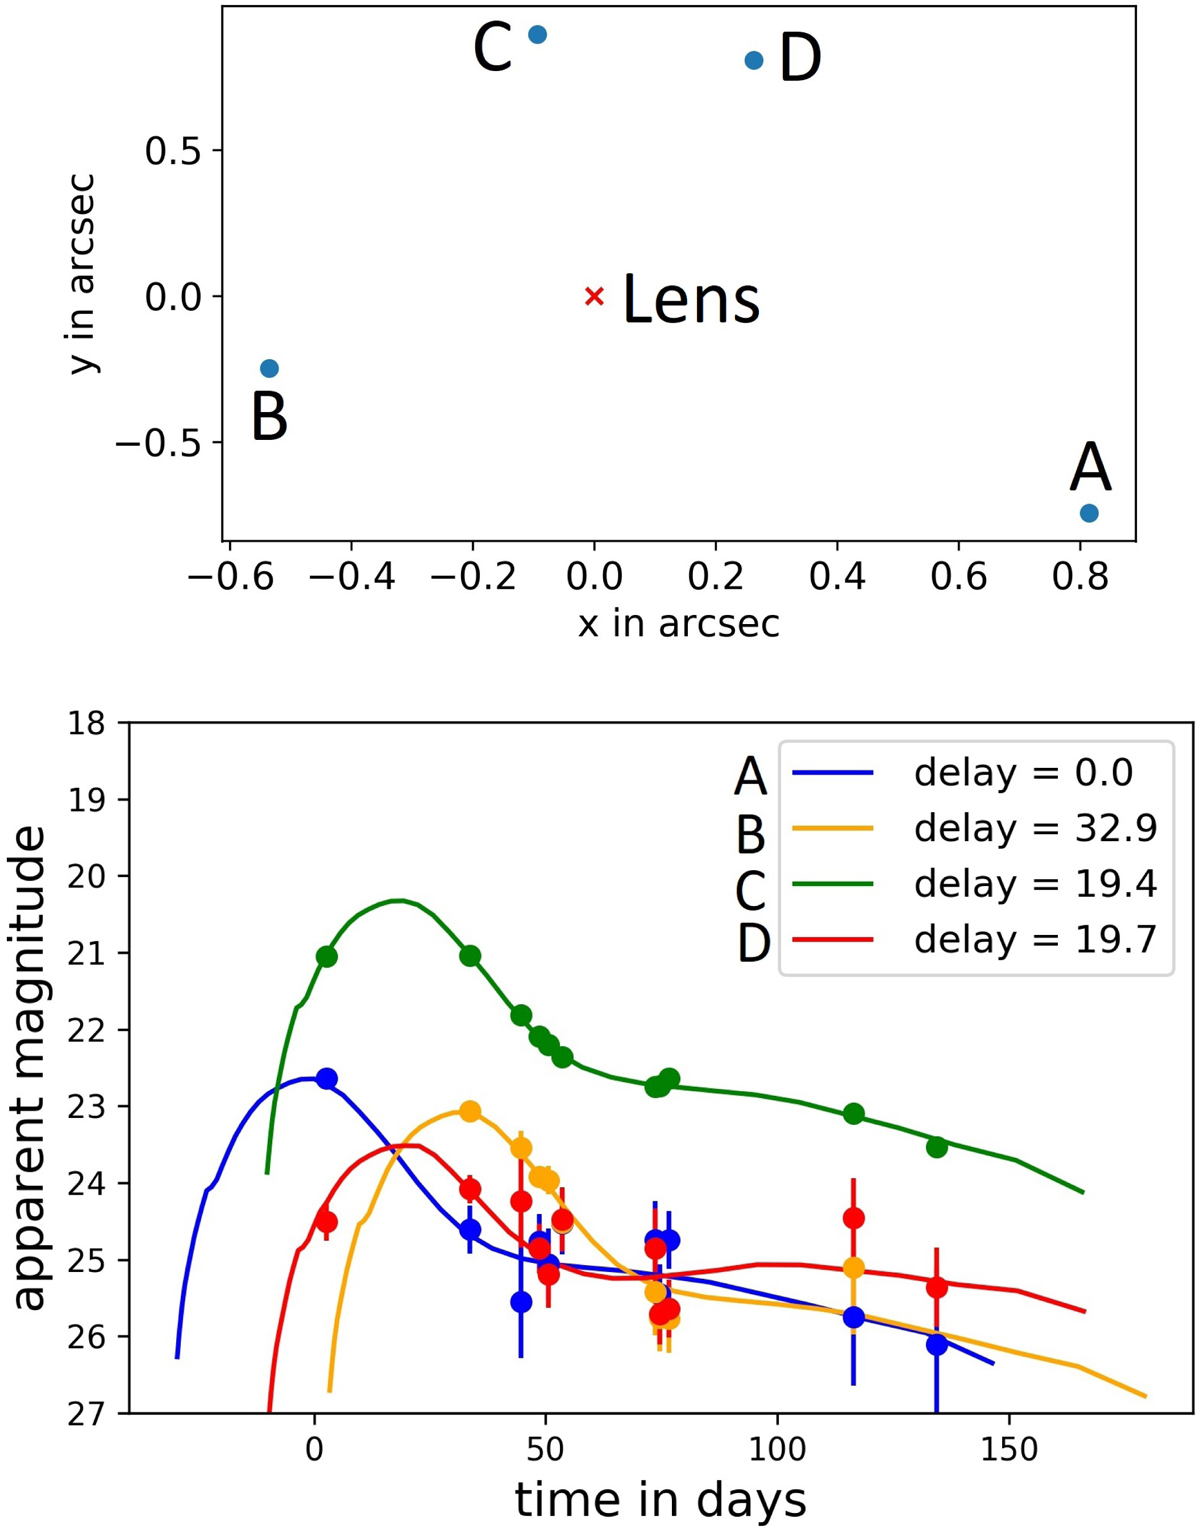
Synthetic i-band light curves (lower panel) of a mock quad LSNe Ia (upper panel) to illustrate simulated observations. The redshift of the source is 0.71 and is taken into account. The observation sequence is for a random field in the WFD survey for the baseline2018a cadence.
Current usage metrics show cumulative count of Article Views (full-text article views including HTML views, PDF and ePub downloads, according to the available data) and Abstracts Views on Vision4Press platform.
Data correspond to usage on the plateform after 2015. The current usage metrics is available 48-96 hours after online publication and is updated daily on week days.
Initial download of the metrics may take a while.