Fig. 4.
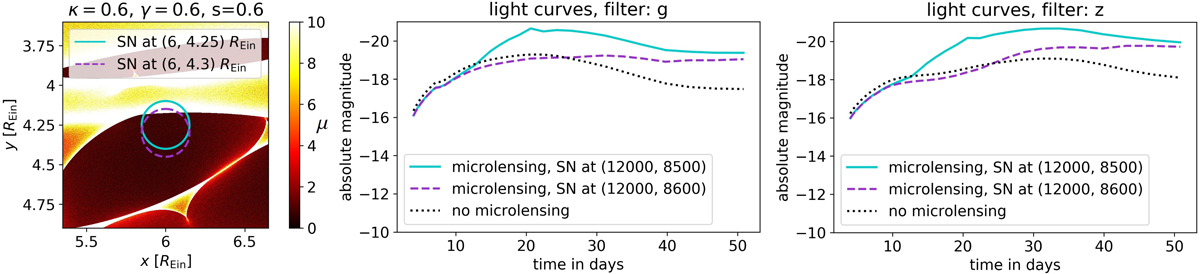
Influence of microlensing on light curves g and z for two different positions (solid cyan and violet dashed) as shown in left panel at 21 days after explosion for magnification map of Fig. 1 where REin = 7.2 × 10⁻³ pc. The case of no microlensing is shown as black dotted line in the middle and right panels. We see that microlensing can cause distortion of light curves, shift the peaks and therefore add uncertainties to time-delay measurements between images undergoing different microlensing.
Current usage metrics show cumulative count of Article Views (full-text article views including HTML views, PDF and ePub downloads, according to the available data) and Abstracts Views on Vision4Press platform.
Data correspond to usage on the plateform after 2015. The current usage metrics is available 48-96 hours after online publication and is updated daily on week days.
Initial download of the metrics may take a while.